I'd like to ask if it's possible to label each of the points plotted by stat_sum with the percentage (i.e. the proportion) of the observations that that point represents. Ideally I would like the label to be in percent format rather than decimal.
Many thanks for your time.
Edit: Minimal reproducible example
library("ggplot2")
library("scales")
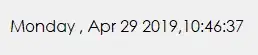
ggplot(diamonds, aes(x = cut, y = clarity)) +
stat_sum(aes(group = 1)) +
scale_size_continuous(labels=percent)
So my question is, how (if possible) to label each of those summary points with their 'prop' percentage value.