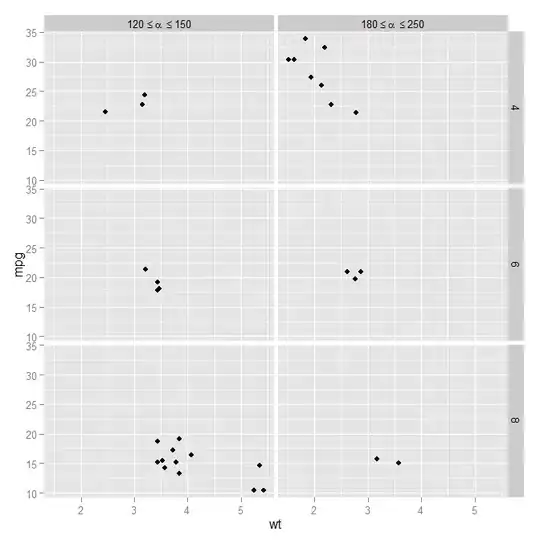
I am trying to plots subsets of data using facet plot. It is 2 columns x4 row plots. First column with values between 120 and 150, and second column with values between 180 and 250, and the variables are assigned as Lesser or Greater in datafile. I am facing problem with adding of specific labels ('120 <= greek symbol(alpha) <= 150', '180 <= greek symbol(alpha) <= 250) to the column variables ("Lesser", "Greater"). I tried doing it as:
require(graphics)
library(ggplot2)
hp <- ggplot2(data) + ....
xlow <- paste("120 <", expression(alpha), " < 150")
xhi <- paste("180 <", expression(alpha), " < 250")
mf_labeller <- function(var, value){
  value <- as.character(value)
  if (var=="regime") {
  value[value=="Lesser"] <- xlow
  value[value=="Greater"]  <- xhi
}
  return(value)
}
(hp %+% data) + facet_grid(param~regime,  scales="free", labeller=mf_labeller)
I get "Error in value == "Greater" : comparison is not allowed for expressions". I tried coercing the data too. If I do the labelling as in any way:
data2 <- transform(data, regime = factor(regime, levels=c("Lesser", "Greater"), labels=c(expression(paste("120 <", alpha," < 150")), expression("180 < alpha < 250"))))
I get the whole expression verbatim, and not the desired plots. I may be missing something. Any help is really appreciated!! Thank you in advance..
The excerpts of my sample is:
regime,param,line,XX,Var,sner
Lesser,Rise,VII,AA,4.968624,0.1275248
Lesser,Rise,VII,BB,3.719405,0.08470305
Lesser,Rise,VII,CC,7.608773,0.177848
Lesser,Rise,VII,DD,9.874395,0.1367159
Lesser,Text,VII,AA,4.968624,0.1275248
Lesser,Text,VII,BB,3.719405,0.08470305
Lesser,Text,VII,CC,7.608773,0.177848
Lesser,Text,VII,DD,9.874395,0.1367159
Lesser,Chant,VII,AA,0.1771826,0.186758
Lesser,Chant,VII,BB,0.3611497,0.5484656
Lesser,Chant,VII,CC,0.7719002,0.8864444
Lesser,Chant,VIII,DD,1.829022,0.2639881
Greater,Rise,VII,AA,4.968624,0.1275248
Greater,Rise,VII,BB,3.719405,0.08470305
Greater,Rise,VII,CC,7.608773,0.177848
Greater,Rise,VII,DD,9.874395,0.1367159
Greater,Text,VII,AA,4.968624,0.1275248
Greater,Text,VII,BB,3.719405,0.08470305
Greater,Text,VII,CC,7.608773,0.177848
Greater,Text,VII,DD,9.874395,0.1367159
Greater,Chant,VII,AA,0.1771826,0.186758
Greater,Chant,VII,BB,0.3611497,0.5484656
Greater,Chant,VII,CC,0.7719002,0.8864444
Greater,Chant,VIII,DD,1.829022,0.2639881
and code I used: I wrote earlier expression in wrong way here in post, but i did use the correct one in code.
x <- read.table("sample.csv", header=T, sep=',')
require(graphics)
library(ggplot2)
ppi <- 300
png("figure.png", width=6*ppi, height=6*ppi, res=ppi)
hp <- ggplot(data=x,aes(x=XX, y=Var, colour=line, group = line)) + geom_errorbar(aes(ymin=Var-sner, ymax=Var+sner, colour=line), width=.3) + geom_line(aes(ymax=Var+sner), size=0.7) + geom_point(aes(ymax=Var+sner), shape=21, size=2,fill="white") + theme_bw() + theme(axis.text.x = element_text(angle=90,vjust=0.25), panel.grid.minor=element_blank(), panel.grid.major=element_blank(), panel.background =element_blank(), legend.position="none" ) + scale_colour_hue(l=40)
xlow <- expression(paste("120 <",alpha," < 150"))
xhi <- expression(paste("180 <", alpha," < 250"))
.. earlier code block as alternative here...
data2 <- transform(x, regime = factor(regime, levels=c("Lesser", "Greater"), labels=c( bquote(120<.(alpha)~phantom()<150), bquote(180<.(alpha)~phantom()<250) )
(hp %+% data2) + facet_grid(param~regime,  scales="free", labeller=label_bquote)
I tried as earlier with mf_labeller too.. Thank you in advance