In addition to the previous answer, once you construct a 3-D scatterplot, you can add a plane to it by creating a model and parsing it using a function nested within your scatterplot3d() container. It should look something like this:
plot3d <- scatterplot3d(x, y, z, ... )
model  <- lm(y ~ sqrt(c + x^2) + z)
plot3d$plane3d(model)
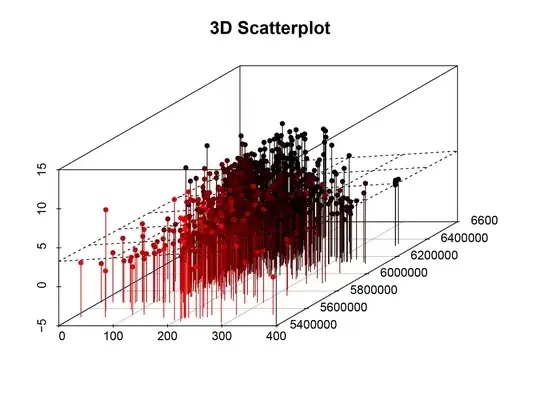
It's a very weird syntax to have a function within a container like that, but it works, giving you something like this (the dotted-line plane is visible near the center of the cube):
If you would like to create one or multiple planes manually, I would use Uwe's method that I re-posted here:
spd <- scatterplot3d(1:10, 1:10, 1:10)

# xy
spd$plane3d(0.3549896,0,0,lty="dotted")

# yz
x0 <- 5
xyz1 <- spd$xyz.convert(rep(x0, 6), rep(0, 6), seq(0, 10, by=2))
xyz2 <- spd$xyz.convert(rep(x0, 6), rep(10, 6), seq(0, 10, by=2))
segments(xyz1$x, xyz1$y, xyz2$x, xyz2$y, lty="dotted")

xyz1 <- spd$xyz.convert(rep(x0, 6), seq(0, 10, by=2), rep(0, 6))
xyz2 <- spd$xyz.convert(rep(x0, 6), seq(0, 10, by=2), rep(10, 6))
segments(xyz1$x, xyz1$y, xyz2$x, xyz2$y, lty="dotted")

# zx
y0 <- 6
xyz1 <- spd$xyz.convert(rep(0, 6), rep(y0, 6), seq(0, 10, by=2))
xyz2 <- spd$xyz.convert(rep(10, 6), rep(y0, 6), seq(0, 10, by=2))
segments(xyz1$x, xyz1$y, xyz2$x, xyz2$y, lty="dotted")

xyz1 <- spd$xyz.convert(seq(0, 10, by=2), rep(y0, 6), rep(0, 6))
xyz2 <- spd$xyz.convert(seq(0, 10, by=2), rep(y0, 6), rep(10, 6))
segments(xyz1$x, xyz1$y, xyz2$x, xyz2$y, lty="dotted")
This produces planes through manual specification: