Possible Duplicate:
How can you profile a Python script?
I'm developing an API with several packages collaborating together via various gui's and I'm slowly thinking about how I would be able to analyze the amount of calls the packages and modules and methods and classes are getting from the user under a normal run. Thinking I might be able to detect bottlenecks and find out where most of the work is required, while also seeing where I might be able to merge similar functionality.
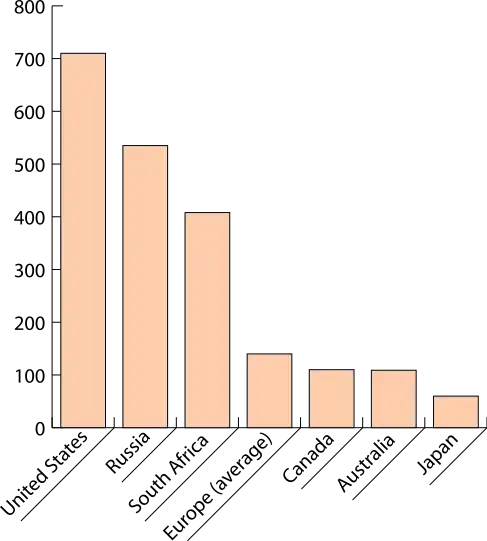
I'm picturing it like a simple bar chart

Where each bar represents one method, module or package depending on which "depth" you're interested to look at, and the height axis is the amount of calls it has gotten.
Is there anything similar currently and/or how would you implement this in Python?
I'm thinking of putting a simple logger at the entrance of each method, under say Debug, and then filter those out when I'm making the diagram. But that means my code would get messier and I'd have to remember to do it for all of them. What would be easier is if I could apply a compile-time decorator when compiling it with say a certain flag. Is that possible with Python?
Thanks