I have run my app with instrument and i m getting a memory leak but i dont know at which point that memory leak is happening.
How will i know at which point memory is leaking.
I have run my app with instrument and i m getting a memory leak but i dont know at which point that memory leak is happening.
How will i know at which point memory is leaking.
Check out this article "Actually finding a memory management error with Instruments", from the big nerd ranch. Creating "heapshots" is a good way to start narrowing down the code parts that show no obvious memory management errors at first glance. But as ACB stated already, if a system library is leaking (rare case) there's not much you can do about it. But most of the time the memory issue is always in your apps' code somewhere! :-)
It says responsible library is quartzcore, and it is only 16 bytes. As long as it is not in the app and the OS is causing the same, you cant do much about this. I would recommend you to ignore this.
If you are facing issues, check the allocation tool -> Live bytes section and check if memory is shooting up when you are selecting a lot of images at the same time.
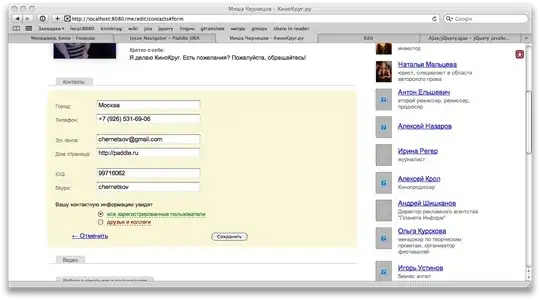
I can see from your screenshot that your app is already running in your device/simulator and you are trying to run it again with instrument, try to close your app completely from device and then start it again with instrument.
You can read more details about Xcode instrument from Apple.developer InstrumentsUserGuide
Also I have found another good tutorial about this in Raywenderlich blog
Another good documents is here