7

I want to create a 3d plot with densities.

I use the function density to first create a 2d dimensional plot for specific x values, the function then creates the density and puts them into a y variable. Now I have a second set of x values and put it again into the density function and I get a second set of y variables and so on.... I want to put those sets into a 3d plot, I hope you know what I mean. So I have a surface of densities....

E.g. I have:

x1<-c(1:10)
x2<-c(2:11)
y1<-c(1,1,2,1,3,4,2,3,2,2)
y2<-c(1,2,3,1,3,6,2,8,2,2)
.
.
.
.

Now I want to put on the x axis for the first value 1 the first set , on the y axis the corresponding x values and on the z axis the densities. So I have a "disk" for x=1, for x=2 I have the second "disk" and so on, so I get a density "mountain".

I hope I am understandable, if you have a better idea to realize it then you are welcome! I want to do it with the persp function, would be nice if you make an example with that function,

Thanks a lot for your help.
user1690846
  • 255
  • 1
  • 2
  • 11
  • Try ```?persp```. But a better option is probably to use something like ```bkde2D``` in the ```KernSmooth``` package. – orizon Nov 29 '12 at 01:15
  • I don't understand. Your example doesn't seem to match your text. In the text you say you create why values with the density() function but in the example you seem to type them in yourself. Could you explain differently? – Peter Ellis Nov 29 '12 at 08:53
  • 1
    well, basically I want to recreate this plot: http://de.wikipedia.org/wiki/Datei:GBM_density_develop.png I know I did a post about before it, but I did not any helpful answer. You commented already on my other posts but you did not help me! So all I want is to do a 3d plot for my presentation where I want to do a 3d density plot. So for each x value (for each time point) I have for different stock prices a density. That's what I want. I know persp exists, but I don't know how to implement it! @PeterEllis – user1690846 Nov 29 '12 at 09:29
  • bkde2D does not help @orizon – user1690846 Nov 29 '12 at 09:29
  • I would be very happy to answer your questions if I could understand what you were asking! This latest link does not help I am afraid. This is just an image with no description of what it is showing and there is absolutely no apparent connection between it and your question. Just as a starter, the two named dimensions in the image are time and S, with density as the vertical (z) axis. Your question talks about y as being created by the density() function from an arbitrarily typed in x. How can this possibly relate to the image you have posted to? – Peter Ellis Nov 29 '12 at 09:35
  • @PeterEllis I am talking about the following posts: http://stats.stackexchange.com/questions/44276/how-to-plot-3d-gbm http://stackoverflow.com/questions/13387119/how-can-i-recreate-this-3d-histogram What I have posted here in this post, was just an idea of mine how to recreate the picture. The idea behind is that I want to model the GBM in a 3d way. So with a drift and a volatility which is increasing with time as you can see in the plot. So all I want is to implement a nice cool 3d graphic in my presentation. I think it is the best to do it with persp, but I don't know how to implement this. – user1690846 Nov 29 '12 at 09:47

2 Answers2

11

I'm afraid I can't make head or tail out of your question. But here is how you draw a plot of the sort I think you are looking for from a two dimensional dataset for which you first estimate the bivariate density:

x <- rnorm(1000)
y <- 2 + x*rnorm(1000,1,.1) + rnorm(1000)
library(MASS)
den3d <- kde2d(x, y)
persp(den3d, box=FALSE)

enter image description here

Then there are many options for persp, check out

?persp
Peter Ellis
  • 5,694
  • 30
  • 46
11

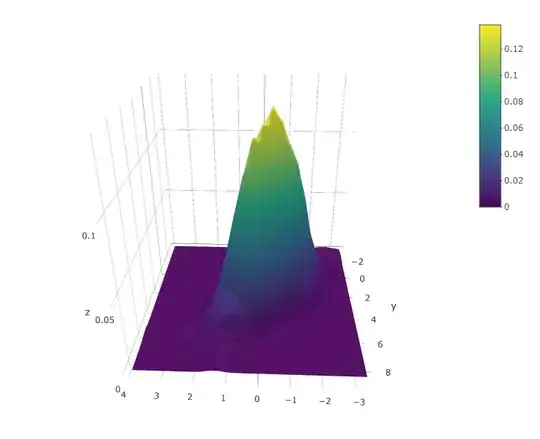
Building on Peter answer. The plot can now be more interesting, prettier and interactive with the plotly library.

x <- rnorm(1000)
y <- 2 + x*rnorm(1000,1,.1) + rnorm(1000)
library(MASS)
den3d <- kde2d(x, y)

# the new part:
library(plotly)
plot_ly(x=den3d$x, y=den3d$y, z=den3d$z) %>% add_surface()

which gives:

enter image description here

Bastien
  • 3,007
  • 20
  • 38