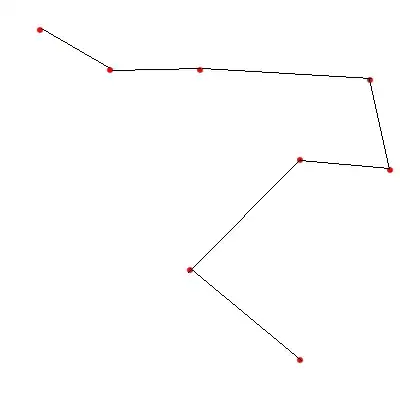
I have implemented one algorithm (RLSR) which there are two regularization factor. Based on different value of this two factors my cost function decreases or increase. Right now I visualize my error with plt.scatter by passing the error as the color which result :
but the problem here is my values in y-axis are very small so as you can see they overlap and I can not see some part of my results.
alpha_list=[1e-11,1e-10,1e-10,5*1e-10,8*1e-10,1e-8,1e-8,5*1e-8,8*1e-6,1e-6,1e-6,5*1e-6,8*1e-6,1e-4,1e-4,5*1e-4,8*1e-4,1e-3,1e-3,5*1e-3,6*1e-3,8*1e-3]
I tried to decrease the transparency but It didn't help much!
and this is how I implemented it :
eigenvalues,alphaa  = np.meshgrid(eigRange,alpha_list )

fig = plt.figure()
DatavmaxTrain = np.max(normCostTrain)
DatavminTrain = np.min(normCostTrain)

DatavmaxTest = np.max(normCostTest)
DatavminTest = np.min(normCostTest)

plt.subplot(211)

plt.scatter(eigenvalues,alphaa,s=130, c=normCostTrain,cmap=cm.PuOr, vmin=DatavminTrain, vmax=DatavmaxTrain, alpha=0.70) #-----for train


cb1=plt.colorbar()
cb1.set_label("normalized square error")

plt.title("Train ")
plt.xlabel("No. of Eigenvalues")
plt.ylabel("Regualrization parameter")
So I am looking for a better way to visualize my data.
Thanks