1

I am looking for a javascript library capable of drawing a bar chart with confidence interval. The output should look like here:

  • horizontal bars
  • line markers, indicating the lower and upper confidence interval.

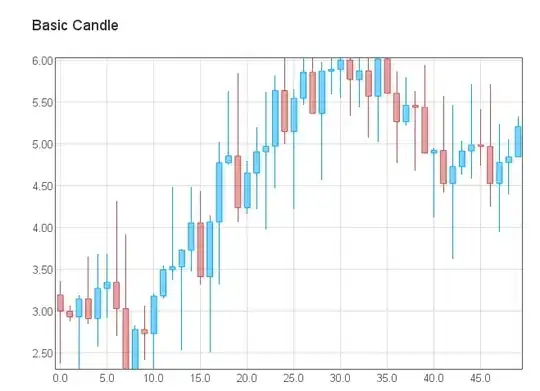
Basically, I am looking for something similar to candle stick / open high low closed graph. However, the value should preferably be displayed as a horizontal bar and the independent variable is not a time series, but a set of categories.

Edit: Does anyone know if KendoUI is capable of doing this?

Community
  • 1
  • 1
Tadej Mali
  • 1,143
  • 8
  • 18

2 Answers2

2

dygraphs has confidence intervals as you can see:

dygraphs screenshot

Janus Troelsen
  • 20,267
  • 14
  • 135
  • 196
  • Yes, I have seen this one, but it is a line graph. I need horizontal bars. I also checked the Google charts "candle stick" but have not found an option to swap the x and y axis. – Tadej Mali Dec 17 '12 at 12:46
1

flotr2 can do this vertically:

http://humblesoftware.com/flotr2/#!basic-candlebasic candle with flotr2

Janus Troelsen
  • 20,267
  • 14
  • 135
  • 196
  • Thanks for the effort, but I can also not accept this as an answer, because I am looking for horizontal bars. – Tadej Mali Dec 19 '12 at 15:12