27

I am trying to plot two 3D surfaces on the same axes in matplotlib with the plot_surface command.

fig = plt.figure()
fig.figsize = fig_size
ax = fig.gca(projection='3d')

surf = ax.plot_surface(X, Y, Exp_Fric_map, alpha = 1, rstride=1, cstride=1, cmap=cm.winter, linewidth=0.5, antialiased=True)
surf = ax.plot_surface(X, Y, Fric_map, alpha = 1, rstride=1, cstride=1, cmap=cm.autumn,linewidth=0.5, antialiased=True)

The problem I have is that when viewing the plot, not always the correct surface is 'on top', for instance in the plot:

Example plot

in the back corner (200N, 2.5Hz on the axes) the blue-green surface is 'on top' when actually the yellow-red is closer to the viewer. If I rotate the plot:

Second example plot

then things look ok now, the blue-green surface is underneath the yellow-red one at 200N and 2.5Hz (now on the left side). I have tried searching stackoverflow and Google but cannot find any similar problems with a solution.

I am using Python 2.7.3, Numpy 1.6.1 and Matplotlib 1.1.1rc on Linux.

Andrew Spencer
  • 273
  • 1
  • 3
  • 6
  • 1
    The same problem occurs when you have two surfaces that intersect. Matplotlib will simply draw the 3D surfaces as 2D projections, each on their own layer, in order. As suggested below, there are other software packages that can visualize multiple 3D surfaces correctly. – feedMe Nov 21 '19 at 10:17

5 Answers5

22

This behavior is documented in matplotlib FAQ here. The same page suggests to install Mayavi which works OK with 3D plots.

  • Its interface is quite similar to matplotlib.
  • Its main problem is that it's still tricky to install it on python 3. (got much easier now)

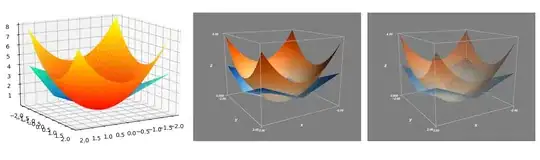
Here's a demo "matplotlib vs mayavi" comparison:

# generate data
import numpy as np

x = np.arange(-2, 2, 0.1)
y = np.arange(-2, 2, 0.1)
mx, my = np.meshgrid(x, y, indexing='ij')
mz1 = np.abs(mx) + np.abs(my)
mz2 = mx ** 2 + my ** 2

# A fix for "API 'QString' has already been set to version 1"
# see https://github.com/enthought/pyface/issues/286#issuecomment-335436808
from sys import version_info
if version_info[0] < 3:
    import pyface.qt


def v1_matplotlib():
    from matplotlib import pyplot as plt
    from mpl_toolkits.mplot3d import Axes3D

    fig = plt.figure()
    ax = fig.gca(projection='3d')
    surf1 = ax.plot_surface(mx, my, mz1, cmap='winter')
    surf2 = ax.plot_surface(mx, my, mz2, cmap='autumn')
    ax.view_init(azim=60, elev=16)
    fig.show()


def v2_mayavi(transparency):
    from mayavi import mlab
    fig = mlab.figure()

    ax_ranges = [-2, 2, -2, 2, 0, 8]
    ax_scale = [1.0, 1.0, 0.4]
    ax_extent = ax_ranges * np.repeat(ax_scale, 2)

    surf3 = mlab.surf(mx, my, mz1, colormap='Blues')
    surf4 = mlab.surf(mx, my, mz2, colormap='Oranges')

    surf3.actor.actor.scale = ax_scale
    surf4.actor.actor.scale = ax_scale
    mlab.view(60, 74, 17, [-2.5, -4.6, -0.3])
    mlab.outline(surf3, color=(.7, .7, .7), extent=ax_extent)
    mlab.axes(surf3, color=(.7, .7, .7), extent=ax_extent,
              ranges=ax_ranges,
              xlabel='x', ylabel='y', zlabel='z')

    if transparency:
        surf3.actor.property.opacity = 0.5
        surf4.actor.property.opacity = 0.5
        fig.scene.renderer.use_depth_peeling = 1


v1_matplotlib()
v2_mayavi(False)
v2_mayavi(True)

# To install mayavi, the following currently works for me (Windows 10):
#
#   conda create --name mayavi_test_py2 python=2.7 matplotlib mayavi=4.4.0
#    (installs pyqt=4.10.4 mayavi=4.4.0 vtk=5.10.1)
#    * the `use_depth_peeling=1` got no effect. Transparency is not correct.
#    * requires `import pyface.qt` or similar workaround
#
# or
#
#   conda create --name mayavi_test_py3 python=3.6 matplotlib
#   conda activate mayavi_test_py3
#   pip install mayavi

matplotlib vs mayavi_no_transparency vs mayavi_with_transparency

Igor
  • 1,359
  • 19
  • 34
  • Python 3 support is ok now. If you want to use opacity you will run into the same trouble as with matplotlib, unless enable depth peeling: `f.scene.renderer.use_depth_peeling=1` – sedot Sep 17 '18 at 14:07
  • @sedot, thanks for noting that! I've updated the answer to reflect this. However, `use_depth_peeling` does not work for me in python 2.7 mayavi=4.4.0. Not sure if there's any newer working mayavi windows binary for python 2.7 somewhere. (Personally, I don't use python 2.7, but the original question is about it.) – Igor Sep 22 '18 at 01:51
  • Note that for mayavi to render this correctly you need to ensure that the right backend is used. For example, for me everything works fine if I use 'ipython3 --gui=qt`. However, if I do not specify the qui backend, then the result will be the same as for matplotlib, i.e. the surfaces do not intersect each other correctly. – laolux Sep 19 '19 at 06:47
13

It's just like painting. which one is 'on top' is determined by which one you draw at last.

You might want to use zorder property to tell matplotlib in what order the surfaces should be painted.

For example:

ax.plot_surface(X, Y, Exp_Fric_map, alpha = 1, rstride=1, cstride=1, cmap=cm.winter, linewidth=0.5, antialiased=True, zorder = 0.5)
ax.plot_surface(X, Y, Fric_map, alpha = 1, rstride=1, cstride=1, cmap=cm.autumn,linewidth=0.5, antialiased=True, zorder = 0.3)

Update:

I have run a couple of tests and I believe it is a bug of matplotlib while painting multiple surfaces in a single figure. For example, it made some surfaces that should not exist in our 3D-world like:

enter image description here

, and I can see no effective solution after trying. The causation is the order of painting, as I said: matplotlib always paints things one by one. if a part of a surface should be on top, and another part of it should be on bottom, matplotlib will go wrong.

Therefore my suggestion would be that stop tackle this problem, it's a waste of time unless you want to contribute to matplotlib. If this is mandatory for you to solve, I would suggest that just go to find another plotting tool to finish your job.

Timothy
  • 4,467
  • 5
  • 28
  • 51
  • Thanks for the answer! But this isn't exactly what I want to achieve. I want whichever surface is closer (i.e. with a larger z-axis value) to be in-front. As the plots are at the moment, it is very confusing to interpret the data. In the first plot the blue-green surface should for the most part be hidden behind the yellow-red surface, when infact it is shown in front. I could plot the yellow-red surface last so that it is in front, but then this would be incorrect for other regions of the plot where the blue-green surface has a larger z-axis value. – Andrew Spencer Dec 18 '12 at 12:28
  • @AndrewSpencer I would suggest looking into enthought's `mayavi` – tacaswell Dec 18 '12 at 12:28
  • @AndrewSpencer give me a few minutes to think about. – Timothy Dec 18 '12 at 12:40
  • @Skyler Thanks! I agree with your answer. For most of my plots it is possible to orientate them in such a way that they display ok, for the others I will look into mayavi. – Andrew Spencer Dec 18 '12 at 14:56
  • @tcaswell Thanks as well, I have started to look at mayavi as a long term fix, it will take a bit of time to learn the interface but I can see that this could also be a solution to my problem. – Andrew Spencer Dec 18 '12 at 14:56
  • 1
    I think it is less a bug and more of a missing feature. As I understand it all the 3D plotting as a bit of a hack. @AndrewSpencer mayavi is much less intimidating than it looks. – tacaswell Dec 18 '12 at 20:46
  • 2
    This problem still exists as of Aug 2016. – Turtles Are Cute Aug 28 '16 at 07:09
  • 2
    This is quite frustrating. – mxmlnkn Jan 22 '17 at 03:32
  • This is not a bug, this is a [documented limitation](https://stackoverflow.com/a/43004221/1032586). – Igor Jul 11 '19 at 12:22
1

One can do a manual fix for this. It is obviously not the most clean solution, but it gives you what you want. Say you want to plot Z1 and Z2 for a common X and Y.

  1. Create an array Z1_gte, being a copy of Z1 where Z1>=Z2 and np.nan otherwise.
  2. Create an array Z1_lte, being a copy of Z1 where Z1<=Z2 and np.nan otherwise.
  3. Plot three surfaces in the following order: Z1_lte, Z2, Z1_gte. When viewing from high to low along the z-axis, your surfaces will look correct. Reverse te order if you want the surfaces to look correct when viewing from low to high along the z-axis.

Or directly:

ax.plot_surface(X,Y,np.where(Z1<Z2,Z1,np.nan))
ax.plot_surface(X,Y,Z2)
ax.plot_surface(X,Y,np.where(Z1>=Z2,Z1,np.nan))

Obvious drawback of this method is that it only works for one specific viewing-direction along the z-axis.

Sam Hoste
  • 11
  • 1
0

Another hack that could be useful for some applications here is to change your surface to one color and the alpha value to lets say 0.5 for both surfaces, then you will be able to at least get a hint of what is going on by rotating the surface. This is quick if you are debugging your crossing surfaces or as in my case if you want to check how your smoothing of spikes look. Blue is smoothed surface below and red is the original one.

Profile of two surfaces

Mianen
  • 116
  • 1
  • 4
0

You can circumvent the problem by plotting the two at the same time. Just append the two matrices and specify separate colors for them.

def plotTwo(ax, X, Y, Z1, Z2):
    col1 = np.full(Z1.shape, 'b', dtype='U50')
    col2 = np.full(Z2.shape, 'r', dtype='U50')
    ax[2].plot_surface(np.append(X, X, axis=0),
                      np.append(Y, Y, axis=0),
                      np.append(Z1, Z2, axis=0),
                      facecolors= np.append(col1, col2, axis=0),
                      edgecolor='none', alpha=1)
Tim Kuipers
  • 1,705
  • 2
  • 16
  • 26
  • This is a good starting point but you still have two problems: the two surfaces get connected with a connecting surface and you need a very high resolution otherwise the picture looks ugly at the intersection. I guess both problems can be solved. The connecting surface between the two plotted surfaces can be moved just to one side of the picture by reversing the order of one of the appended arrays and then clipped. The ugliness of the intersection should be improbable simply by interpolation. – gagi Feb 15 '23 at 13:51