Possible Duplicate:
Shading a kernel density plot between two points.
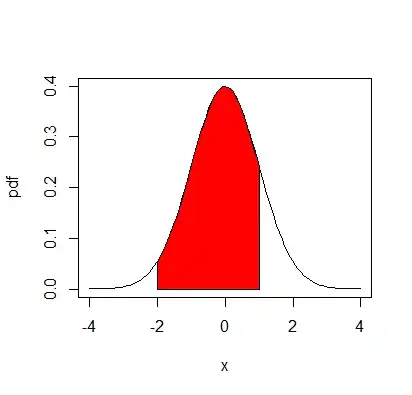
How to draw this graph in R, assuming normal pdf?

Possible Duplicate:
Shading a kernel density plot between two points.
How to draw this graph in R, assuming normal pdf?
I answered that a while back on StackOverflow for something closely related. The question really is a duplicate and should be closed. All these how do I shade below a curve questions are answered by a close read of help(polygon) and a study of the existing examples.
The code for getting shaded area below:
plot(dnorm,-4,4,xlab="x",ylab="pdf")
xvals <- seq(-2,1,length=50)
dvals <- dnorm(xvals)
polygon(c(xvals,rev(xvals)),c(rep(0,50),rev(dvals)),col="gray")
Result: