3

I have the following code that makes four subplots in one figure:

f = figure( figsize=(7,7) )
f.add_axes([0.2,0.175,0.75,0.75])
f.subplots_adjust(left=0.15)
f.clf()
ax = f.add_subplot(111)
ax1 = f.add_subplot(221)
ax2 = f.add_subplot(222)
ax3 = f.add_subplot(223)
ax4 = f.add_subplot(224)
ax.xaxis.set_major_formatter( NullFormatter() )
ax.yaxis.set_major_formatter( NullFormatter() )
ax2.xaxis.set_major_formatter( NullFormatter() )
ax2.yaxis.set_major_formatter( NullFormatter() )
ax1.xaxis.set_major_formatter( NullFormatter() )
ax4.yaxis.set_major_formatter( NullFormatter() )
f.subplots_adjust(wspace=0,hspace=0)

ax1.plot(tbins[0:24], mean_yszth1, color='r', label='mean', marker='.', lw=3)
ax2.plot(tbins[0:24], mean_ysz1, color='r', label='mean', marker='.', lw=3)
ax3.plot(tbins[0:24], mean_yszth2, color='r', label='mean', marker='.', lw=3)
ax4.plot(tbins[0:24], mean_ysz2, color='r', label='mean', marker='.', lw=3)

ax1.set_xlim(0,12)
ax1.set_ylim(-0.5,0.5)
ax2.set_xlim(0,12)
ax2.set_ylim(-0.5,0.5)
ax3.set_xlim(0,12)
ax3.set_ylim(-0.5,0.5)
ax4.set_xlim(0,12)
ax4.set_ylim(-0.5,0.5)
ax.set_xlabel(r"$\mathrm{Time\ since\ last\ merger\ (Gyr)}$")
ax.set_ylabel(r"$\mathrm{\Delta Y_{SZ}/Y_{SZ}}$")

The result looks like this:

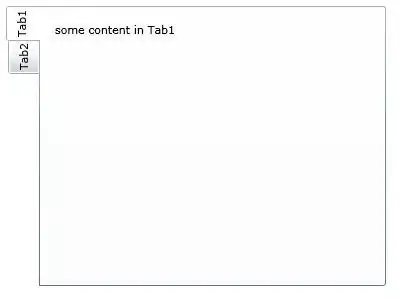
As you can see, the axis labels overlap with the ticks. I would like to move the common axis labels away from the axes a little. I can't figure out how best to do this.

ylangylang
  • 3,294
  • 11
  • 30
  • 34

1 Answers1

3

Use labelpad parameter of set_ylabel and set_xlabel methods:

Definition: ax.set_ylabel(self, ylabel, fontdict=None, labelpad=None, **kwargs)
Docstring:
Call signature::

  set_ylabel(ylabel, fontdict=None, labelpad=None, **kwargs)

Set the label for the yaxis

*labelpad* is the spacing in points between the label and the y-axis

This is what I get with labelpad set to 50 (x) and 60 (y). I had to modify manually figure margins as the labels were outside the figure frame when using the default configuration.

enter image description here

Edit
From your comments it seems you could be using a very old version of matplotlib. Labelpad parameter has been in matplotlib from many versions ago but the way to of setting it could be different (I do not know for sure).
In the web I found some comments that point to this usage:

ax.xaxis.LABELPAD = 8  # default is 5

also I have seen it like:

ax.xaxis.labelpad = 8
joaquin
  • 82,968
  • 29
  • 138
  • 152
  • This is what I did: `ax.set_ylabel(ylabel, labelpad=10)`. But I get an error saying `Unknown property labelpad`. Maybe my version of Python is too old? – ylangylang Dec 31 '12 at 12:00
  • which version are you using ? It works for me with your figure settings on mpl vs 1.2.0 (windows 7 64bit). But I think this parameter should work also in previous versions (at least mpl 0.99.1) – joaquin Dec 31 '12 at 14:56
  • It says Python 2.5.4 on top. I also found this line in the error message: `/scisoft/lib/python2.5/site-packages/matplotlib/axes.pyc in set_xlabel(self, xlabel, fontdict, **kwargs)`. Looks like there's no labelpad in the version that I'm using. – ylangylang Dec 31 '12 at 15:20
  • Seems your error says you are using scisoft package with a version not higher than 7.3 (that had python 2.5). This version uses matplotlib 0.98.5 that is a very old version (more than 3 years old). You should update to the latter scisoft release. – joaquin Dec 31 '12 at 18:54