16

I've had a look at this and this.

But I have a slightly different problem. I know that my data is a sine curve, of unknown period and unknown amplitude, with additive non-gaussian distributed noise.

I'm attempting to fit it using the GSL non-linear algorithm in C, but the fit is absolutely terrible. I'm wondering if I'm (wrongly) using a non-linear fitting algorithm where I should be using a linear one?

How do I tell if a particular dataset requires a linear or a non-linear algorithm?

EDIT: My curve is really noisy, so taking an FFT to figure out the frequency may result in false positives and bad fits. I'm looking for a slightly more robust way of fitting.

Curve with about 170 points

The above plot has about a 170 points as you can see, and the plot below has about 790 points.

enter image description here

The noise is distinctly non-gaussian, and large compared to the amplitude of the data. I've tried FFT's on gaussian-distributed noise, and my fit was wonderful. Here, it's failing quite badly.

ADDED: Link to first time series data. Each column in the file is a different time series.

Community
  • 1
  • 1
Kitchi
  • 1,874
  • 4
  • 28
  • 46
  • Can you post like 10000 points. I got only 88 of them. – Luka Rahne Jan 25 '13 at 20:43
  • @Kitchi: Each time series you posted only has 86 points, that's almost certainly not enough. Could you post just a couple of time series (2-3) with 1000 or more data points each? 10000 would be even better, if possible. – Alex I Jan 26 '13 at 06:15
  • "I know that my data [has] ... additive gaussian distributed noise" or "The noise is distinctly non-gaussian" -- which is it? – j_random_hacker Jan 28 '13 at 07:53
  • @j_random_hacker - Sorry, edited to fix that. – Kitchi Jan 28 '13 at 09:17

4 Answers4

7

If you know that your data is a sine curve, (which can be represented as a number of complex exponentials) then you can use Pisarkenko's harmonic decomposition; http://en.wikipedia.org/wiki/Pisarenko_harmonic_decomposition

However, if you have access to more data points, my approach would still to use an DFT.

UPDATE:

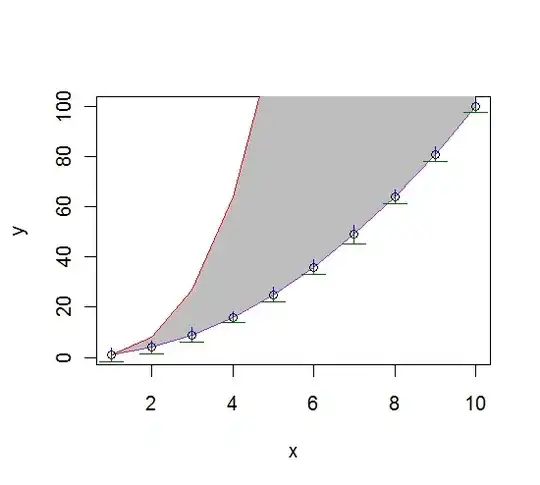
I used Pisarenko's harmonic decomposition (PHD) on your data, and even though your signals are extremely short (only 86 datapoints each), the PHD algorithm definately has potential if there is more data available. Included below are two (column 11 & 13 of your data) out of the 24 signals, depicted in blue, and the sine curve in red corresponds to the estimated amplitude/frequency values from PHD. (note that phase shift is unknown)

plot of data in column 11 plot of data in column 13

I used MATLAB (pisar.m) to perform PHD: http://www.mathworks.com/matlabcentral/fileexchange/74

% assume data is one single sine curve (in noise)
SIN_NUM = 1; 

for DATA_COLUMN = 1:24
    % obtain amplitude (A), and frequency (f = w/2*pi) estimate
    [A f]=pisar(data(:,DATA_COLUMN),SIN_NUM);

    % recreated signal from A, f estimate
    t = 0:length(data(:,DATA_COLUMN))-1;
    y = A*cos(2*pi*f*t);

    % plot original/recreated signal
    figure; plot(data(:,DATA_COLUMN)); hold on; plot(y,'r')
    title({'data column ',num2str(DATA_COLUMN)});

    disp(A)
    disp(f)
end

Which resulted in

1.9727     % amp. for  column 11
0.1323     % freq. for column 11
2.3231     % amp. for  column 13
0.1641     % freq. for column 13

VERIFICATION OF PHD:

I also did another test where I knew the values of amplitude and frequency and then added noise to see if PHD can estimate the values properly from the noisy signal. The signal consisted of two added sine curves with frequencies 50 Hz, 120 Hz respectively, and amplitudes 0.7, 1.0 respectively. In the figure below, the curve in red is the original, and the blue is with added noise. (figure is cropped)

test of PHD accuracy

Fs = 1000; % Sampling frequency
T = 1/Fs; % Sample time
L = 1000; % Length of signal
t = (0:L-1)*T; % Time vector

% Sum of a 50 Hz sinusoid and a 120 Hz sinusoid
x = 0.7*sin(2*pi*50*t) + sin(2*pi*120*t);
y = x + 0.4*randn(size(t)); % Sinusoids plus noise

figure;
plot(Fs*t(1:100),y(1:100)); hold on; plot(Fs*t(1:100),x(1:100),'r')
title('Signal Corrupted with Zero-Mean Random Noise (Blue), Original (Red)')

[A, f] = pisar(y',2); 
disp(A)
disp(f/Fs)

PHD estimated the amp/freq values to be:

0.7493    % amp wave 1  (actual 0.7)
0.9257    % amp wave 2  (actual 1.0)
58.5      % freq wave 1 (actual 50)
123.8     % freq wave 2 (actual 120)

Not bad for quite a bit of noise, and only knowing the number of waves the signal consists of.

REPLY @Alex:

Yeah it's a nice algorithm, I came across it during my DSP studies, and I thought it worked quite well, but it's important to note that Pisarenko's Harm.Dec. models any signal as N > 0 sinusoids, N being specified from start, and it uses that value to ignore noise. Thus, by definition, it is ONLY useful when you know roughly how man sinusoids your data is comprised of. If you have no clue of the value for N and you need to run the algorithm for a thousand different values, then a different approach is definately recommended. That said, evaluation is thereafter straightforward since it returns N amplitude and frequency values.

Multiple signal classification (MUSIC), is another algorithm which continues where Pisarenko left off. http://en.wikipedia.org/wiki/Multiple_signal_classification

Fredrik
  • 2,247
  • 18
  • 21
  • Excellent, I didn't know about this method. Is there any further work or extensions of it? – Alex I Jan 24 '13 at 21:17
  • This is spectacular! Apparently this is a refinement of the maximum entropy method? I haven't tried it out as yet... but your results are really good. Thanks! – Kitchi Jan 28 '13 at 09:20
  • Hi Kitchi! I'm glad i could help. Yes, MEM can definately be used for spectral estimation (its extremely useful for many things), but i believe its assumed the stochastic process which generated the data (which you want to find a model for) is of gaussian nature with zero mean. – Fredrik Jan 28 '13 at 10:47
4

Kitchi: Could you provide some sample data? How long is the typical signal you have to work with? (in terms of number of samples, and number of sine wave periods) What is the signal to noise ratio in dB?

  1. Before you know what algo will work, I recommend you prototype it in python/numpy/scipy (or matlab/octave, or R/S, or Mathematica...) whatever prototyping language/toolset is your favorite, other than C. It will save a huge amount of time, and you'll be working with much richer tools.

  2. Are you sure that noise will affect the FFT badly? That is not necessarily a good assumption, particularly if the noise is relatively "white", and the analysis window is long. If the frequency of the sine wave is very stable, you can do a huge FFT and pull out the signal from noise orders of magnitude stronger than the signal. Try something on the order of a few hundred to a few million cycles of the expected sine wave.

  3. Curve fitting sine waves just doesn't work well. I guess the periodicity creates a lot of local minima, and the phase shift variable makes the problem significantly nonlinear too. You can see some questions from other people who have run into the same problem linked below. You would be better off trying almost anything else rather than nonlinear least squares fit, unless you pre-linearize the problem, which brings me to...

  4. Autocorrelation is excellent for this kind of thing. Try computing autocorrelation on your entire signal at once (the more data the better if source frequency is stable). The sine wave period should be very obvious as a high peak in the autocorrelation, and you will probably get a more accurate estimate of frequency than with FFT (unless you use extremely large FFT). Also, you can calculate the average amplitude from the height of the first high autocorrelation peak.

EDIT: Upon further research, there are more techniques that may be better suited to your problem than FFT. Pisarenko's harmonic decomposition (first suggested by Fredrik Rubin below) is one; the other is Least squares spectral analysis (LSSA) which is very similar to your original question idea. There are a number of variants of LSSA, for example Lomb-Scargle, basis pursuit, etc. which deal in various ways with the fitting problems I described above. However I think if you absolutely cannot see any signal in a large FFT, none of the other methods are likely to find anything either :)

P.S. For other questions related to not being able to fit sine waves well, see:

Community
  • 1
  • 1
Alex I
  • 19,689
  • 9
  • 86
  • 158
  • I've edited my question with screencaps of my data... the length could be variable, as I've shown. I was thinking of shifting to python, since it's easier to experiment with that. I'll try and autocorrelation and see if it works, thanks! – Kitchi Jan 21 '13 at 09:56
  • @Kitchi: if you want me to try anything could you upload a sample data set somewhere? (text or csv file) The main things I'd be interested in are one, how stable is the source frequency, and two, how long it one complete data set you want to fit (longer is *much* better, I recommend thousands to millions of times the period of your signal of interest). Your noise is obviously somewhat biassed to high frequencies, and quite a bit stronger than your signal, so I don't think any technique would work very well unless you have large data sets and a stable source frequency. – Alex I Jan 21 '13 at 10:30
  • I'm not at the machine with the data at the moment, I'll get to it later today. I'll link you to both datasets when I do. The sample size could be anywhere from several to hundred times the period of the signal, but not much larger than that unfortunately. That's where the problem arises. – Kitchi Jan 21 '13 at 10:40
  • Will pastebin do to post the data? Where is a good place to upload it? – Kitchi Jan 24 '13 at 18:16
2

If you are doing regression over sin you can appy Fourier Transform using FFT.

EDIT

Try to remove noise with filter. If you have physical source like sensor, put low pass filter on sensor. FFT is relativly bad filter.

EDIT2 - This measurment is just plain wrong

It might be, that you are doing wrong measurement. According to Nyquist–Shannon sampling theorem your sampling frequency is too low, or input frequency is too high. That result in WRONG solution, becuase if you are sampling for instance 3kHz with 5kHz sampling you will measure 2kHz according to this theorem.

I am sure that you are not able to tell correct input frequency with such measurment.

Luka Rahne
  • 10,336
  • 3
  • 34
  • 56
  • fft a bad filter? how? since you can implement any filter of a given size as fft + convolution + inverse fft, there is no advantage at all to prefiltering. – Alex I Jan 21 '13 at 19:01
  • FFT is not best option for filtering and can be seen using some math analysis. I dont remember all details, but using FIR or even IIR filters for filtering give way better results. "Problem" with FFT is that it has poles of first order where IIR filter has poles of higher order and thus better attenuation after cut off frequency, – Luka Rahne Jan 21 '13 at 20:23
  • How do you know that you are, by applying a filter (of any type) not filtering out the signal you wish to detect? In other words; since the nature of the signal is unknown, how can you select the cutoff frequency for the filter? – Fredrik Jan 25 '13 at 19:22
2

This is actually a spectral estimation problem. You are trying to estimate a 'line spectrum' where you know the number of sine waves you have (in your case, one). Methods like MUSIC or ESPRIT should be able to solve the problem.

For reference, Stoica's book will come in handy. Chapter 4 of this book is parametric methods for line spectra, which contains algorithms for finding amplitude, phase and frequency of the desired signal. The book also comes with algorithms implemented in MATLAB, they are also easy to implement on your own.

yaksoy
  • 141
  • 1
  • 9