3

I have a list of rectangles stored as points. Currently, the data looks something like this:

boxes = [{'p1': (0,0), 'p2': (100,20)},
         {'p1': (5,5), 'p2': (15,15)}, 
         {'p1': (20,5), 'p2': (30,15)},
         {'p1': (35,5), 'p2': (45,15)},
         {'p1': (70,5), 'p2': (80,15)}]

I also have a basic function that tests if a rectangle is contained within another:

def isChild(b1,b2):
    return (b1 != b2 and 
            (b1['p2'][0]-b1['p1'][0] * b1['p2'][1]-b1['p1'][1]) > (b2['p2'][0]-b2['p1'][0] * b2['p2'][1]-b2['p1'][1]) and
            b1['p1'][0] < b2['p2'][0] and 
            b1['p2'][0] > b2['p1'][0] and 
            b1['p1'][1] < b2['p2'][1] and 
            b1['p2'][1] > b2['p1'][1])

I'd like to wind up with a set of rectangles and their children, but I'm not sure how I should store them. I'm thinking something like this:

[{'p1': (0,0), 
  'p2': (100,20),
  'children': [{'p1': (5,5), 'p2': (15,15)}, 
               {'p1': (20,5), 'p2': (30,15)},
               {'p1': (35,5), 'p2': (45,15)},
               {'p1': (70,5), 'p2': (80,15)}]}]

The context of this is that the boxes represent elements on a web page. The data structure is meant to generate the basic markup, so the structure above would wind up being something like this:

<div>
    <div></div>
    <div></div>
    <div></div>
    <div></div>
</div>
  1. Are the source/goal data structures a good fit for this? If not, what is?
  2. How can I get from the source to the goal?
  3. A friend suggested using r-trees. Would that make sense here?
  • This seems to fit well in OO. Using classes or even namedtuples would significantly simplify your code. Depending on your goal or data size, you can go from here to more complex algorithms. – jsz Jan 11 '13 at 07:15
  • What operations do you want to perform on this data? – Evgeny Lazin Jan 11 '13 at 07:23
  • In addition to taking the data and representing it as the last code snippet above, I'd like to be able to move boxes & their children around, ie. taking box A, which is in box B, and moving it into box C. So, I guess insert/delete/sort. – Crawford Comeaux Jan 11 '13 at 07:31
  • Can one of this boxes intersect with many other boxes? Or they form some kind of hierarchy? If this is the case - just use Thorsten's solution. To sort boxes you can use depth first search. If boxes can be placed above each other in any configuration or if you need complex queries (for example: find boxes by coordinates or find only visible boxes) - use spatial data structures. – Evgeny Lazin Jan 11 '13 at 07:42
  • This doesn't answer your question, but your `isChild` function seems to return incorrect results. Using your example data, both `isChild(boxes[0], boxes[1])` and `isChild(boxes[1], boxes[0])` return `True`. – omz Jan 11 '13 at 07:45
  • Doh! I got that from this post, but forgot to make changes to actually detect which is the parent. As it stands, it only confirms an overlap. [StackOverflow: Determine if two rectangles overlap each other](http://stackoverflow.com/questions/306316/determine-if-two-rectangles-overlap-each-other) – Crawford Comeaux Jan 11 '13 at 11:11
  • The missing piece is to compare the areas of the two rectangles. Edited with the fix. – Crawford Comeaux Jan 11 '13 at 17:12

2 Answers2

3

Use classes. This is a typical usecase for OO programming. Create a class Rectangle

from random import random

class Rectangle(object):
    def __init__(self, x1, y1, x2, y2):
        self._p1 = (x1, y1)
        self._p2 = (x2,y2)
        self._children = []

    def __str__(self):
        return "Rectangle defined by %s, %s, %i children" % (self._p1, self._p2, len(self._children))

    def is_child_of(self, other):
        return (self is not other and 
            self._p1[0] > other._p1[0] and 
            self._p2[0] < other._p2[0] and 
            self._p1[1] > other._p1[1] and 
            self._p2[1] < other._p2[1])

    def add_child(self, other):
        self._children.append(other)

    def check_relation_and_connect(self, other):
        if self.is_child_of(other):
            other.add_child(self)
        elif other.is_child_of(self):
            self.add_child(other)


if __name__=="__main__":
    rectangles = [Rectangle(random()*5, random()*5, random()*5+5, random()*5+5) for i in range(10)]

    for i in range(len(rectangles)):
        for j in range(i):
            rectangles[i].check_relation_and_connect(rectangles[j])

    for rectangle in rectangles:
        print rectangle

The class consist of two points, _p1 and _p2, and a list of children. The logic of finding parent-child relation goes into a method of this class (btw, does your method work? I changed it, as it returned nonsense for me. Maybe I have a different understanding of how the rectangle is defined.)

As you're talking about websites and <div>, I assume you won't have thousands of rectangles. So this approach should be fine.

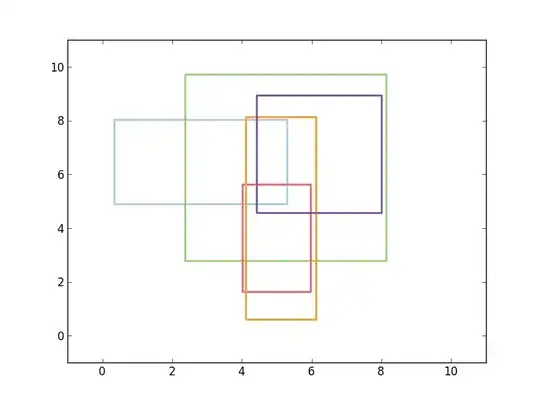
This example can also be extended to plot all rectangles, so one can check the rectangles and the calculated kinship. Keeping class Rectangle unchanged, one can write:

if __name__=="__main__":
    import matplotlib.pyplot as plt
    from matplotlib import patches

    rectangles = [Rectangle(random()*5, random()*5, random()*5+5, random()*5+5) for i in range(5)]

    for i in range(len(rectangles)):
        for j in range(i):
            rectangles[i].check_relation_and_connect(rectangles[j])

    for rectangle in rectangles:
        print rectangle

    colormap = plt.get_cmap("Paired")
    for i, rect in enumerate(rectangles):
        ax = plt.axes()
        color = colormap((1.*i)/len(rectangles))
        patch = patches.Rectangle(rect.p1, rect.p2[0]-rect.p1[0], rect.p2[1]-rect.p1[1], fc="none", ec=color, lw=2)
        ax.add_patch(patch)
    plt.xlim(-1,11)
    plt.ylim(-1,11)
    plt.show()

This gives a plot like: enter image description here

For this example, exactly one Rectangle had a child (violet is a child of green).

Thorsten Kranz
  • 12,492
  • 2
  • 39
  • 56
  • Please don't forget to mark your question as solved so it doesn't appear in the "unanswered"-section anymore. – Thorsten Kranz Jan 11 '13 at 09:46
  • This is pretty close. I'll need to modify it a little so that children are removed from the main list and so that parents only report their immediate children. To be clear, I created a list of 3 concentric rectangles and the result was a list of 3 rectangles, the largest having 2 children, the middle having 1 child, and the smallest having none (pardon the non-python notation): `[r1->[r2,r3], r2->[r3], r3]` when it needs to be: `[r1->[r2->[r3]]]` – Crawford Comeaux Jan 11 '13 at 17:30
0

Quad tree or R-tree (or any other 2-dim spatial data-structure) will be a good fit for that. But if you don't have many of this nested boxes(tens or hundreds), you can just enumerate them each time you need to query your data-structure. If you have many, thousands or more, and need to query them efficiently - use spatial data-structure.

Evgeny Lazin
  • 9,193
  • 6
  • 47
  • 83
  • Since the structure's meant to represent a web page's elements, I can envision one where there's 1000+. The source for this Stack Overflow page contains 575 elements (not including this comment). – Crawford Comeaux Jan 11 '13 at 07:35
  • If I increase the number of rectangles to 1000 in my example, the whole script runs in one second, including plotting all rectangles. Plotting takes about half of the time. Though my algorithm is O(n**2), of course, but you will have to try if it's fast enough for you. *First make it work. Then make it right. Then make it fast." – Thorsten Kranz Jan 11 '13 at 08:03