16

I'm trying to find some Java lib, code example (or a starting point) to help me figure out how can I interpolate a list of 2d points with a weight to generate a interpolation with level curves.

Googling I figure out that there is several algorithms available to do this, and i found some explanations with interesting content. The first algorithm that I want to try is the Inverse Distance Weighted interpolation.

But with all this information i have some basic doubts:

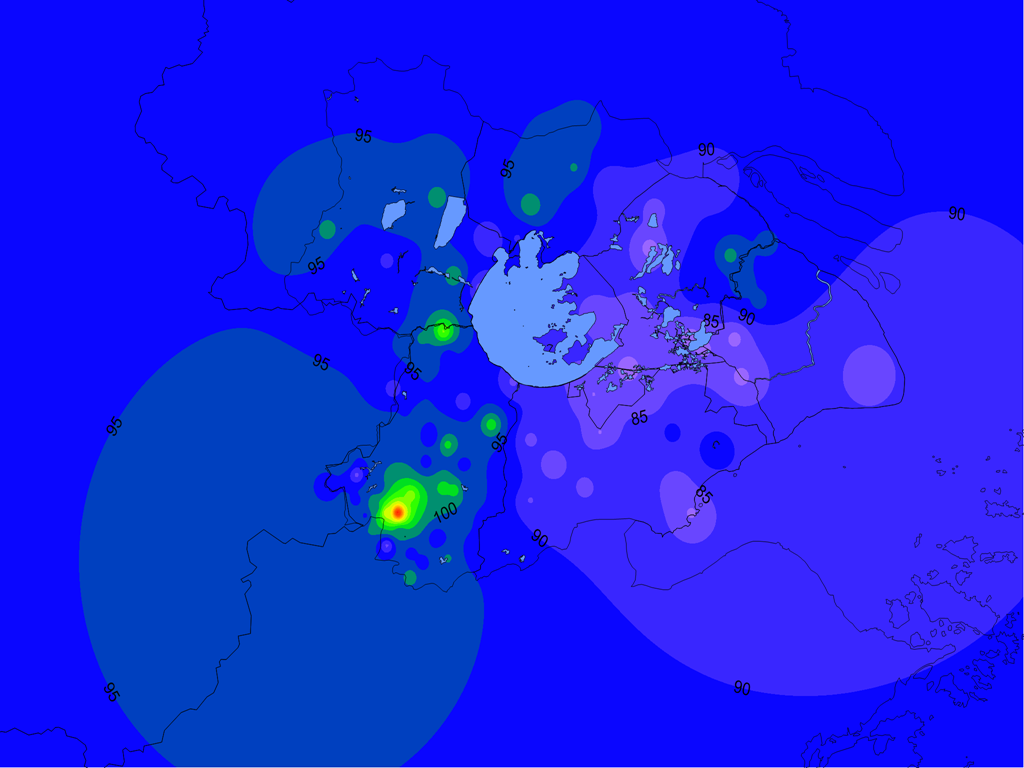
  • To generate one picture like the picture below, i have to do a pixel matrix (with weight), interpolate the data, group pixels together (by color range) and then join the points do draw the curves and put the reference text values like this?

  • If i need to do this pixel matrix, it will be very expensive for a giant interpolation, so can I do less points and use splines to join then to create the color levels?

Example data:

+-------------------+
|  X  |  Y  | WEIGHT|
+-------------------+
|  2  |  5  |   30  |
|  7  |  3  |   25  |
|  1  |  1  |   10  |
|  5  |  6  |   45  |
|  7  |  9  |   15  |
+-------------------+

Example Rules:

  • Value between 00-10: Blue
  • Value between 10-20: Green
  • Value between 20-30: Yellow
  • Value between 30-40: Red

Example results:

Shepard interpolation example

The example data, rules and results are not compatible, are just random examples to explain my prblem.


Here is my final test class: http://pastebin.com/nD6MT8eS

Tiago
  • 2,871
  • 4
  • 23
  • 39
  • Did you consider [linear regression](http://en.wikipedia.org/wiki/Linear_regression)? It also enables you to get a polynom of degree `k` by increasing the dimensions of the problem to `(x,y,xy,x^2,y^2,...,x^(k-1)y,y^(k-1)x,x^k,y^k)`. [Weka](http://www.cs.waikato.ac.nz/ml/weka/) got a [LinearRegression](http://weka.sourceforge.net/doc/weka/classifiers/functions/LinearRegression.html) functionality. Will you find it useful? Or you are strictly looking for *inverse distance weighted*? (Note: Linear regression tries to minimize *squared error* from the prediction to the given data) – amit Jan 15 '13 at 15:51
  • @amit, i need to do it using *inverse distance weighted* and *Kriging* because this two methods are the most used on the industry that the final software will be used. So the stating point will be the *inverse distance weighted*. – Tiago Jan 15 '13 at 15:59
  • You could use JHeatChart to do the drawing. You might need to get the source code so you could try different interpolations. http://www.javaheatmap.com/ – Gilbert Le Blanc Jan 15 '13 at 16:29
  • JHeatChart doesn't do scattered point interpolation, it works with a 2D grid of input data. – japreiss Jan 15 '13 at 16:34
  • Is there anything missing from my answer below? It tells you how to compute images like the one above. If that's not what you want, could you make the question clearer? If you want an image like the one you posted, there's no way to avoid creating an array of pixels at some point. It will have contours implicitly if you segment the colour into bands. If you want to get functions representing the contour lines, that's a different question. Also, you're implying that you want an algorithm. If you'd rather have a library that does it for you, you should make that clear – mo-seph Feb 06 '13 at 12:41

3 Answers3

5

Assuming you've got a Point class you can use (e.g. java.awt.Point), you can put the weights into a Map:

Map<Point,Double> points = new HashMap<Point,Double>();
points.put( new Point(2,5), 30 )
...

Then, you make an image, and for each x,y coordinate, find the best score. I'm assuming that the score is the inverse distance times the weight of the point in the table. If so, it's like this:

image = createBitmap( width, height )
for( int x = 0; x < width; x++ )
    for( int y = 0; y < height; y++ )
    {
         double maxScore = -Double.MAX_VALUE
         for( Point p : points.keySet() ) 
         {
             double score = points.get(p)/p.distance( x, y ) //Inverse distance times point weight
             minDist = Math.max( maxScore, score )
         }
         image.setPixelColour( x, y, getColorForDistance( 1/minDist * points.get(p) )
    }

getColourForDistance( double dist ) should be obvious, although you'll have to set the levels right. I'm assuming createBitmap( width, height ) is creates an image. What kind of image you're making depends on your application, as does whether it has a setPixelColour method or similar. Choice of points class will depend on your application as well.

This is not optimised - it's at least O(x*y*p) where p is the number of points. If p gets large, you might want to look at more sensible data structures for storing points.

mo-seph
  • 6,073
  • 9
  • 34
  • 35
  • do you have any tips on how should i optimize this code? Im using it but with a 3000px x 3000px image + 5 points its slow, and my final goal is generate one image with 1000 points. Thanks. – Tiago Feb 15 '13 at 18:26
  • What is taking the time? Can you profile it? What do you mean by slow (i.e. how long is it taking?). It's going to have to go through 9M pixels, which will generally take some time. You're probably best posting this optimisation as a separate question. If the number of points is large, you could try spatial indexes, or create a minimum distance map by starting at each point and working outwards, then invert it. But really, you need to profile to see what's taking the time. – mo-seph Feb 17 '13 at 15:07
2

To complement the @mo-seph and @Xipan-Xiao answers you can look at the NonGridContourDataset class from jFreeChart project that implements the inverse distance to power algorithm.

1

Don't know how to add comments so I'm adding my thoughts in this answer area.

At least you don't need to "group pixels together (by color range) and then join the points do draw the curves". To generate the picture you need, just do something like:

picture = createBitmap( width, height );
for( int x = 0; x < width; ++ x ){
    for( int y = 0;y < height; ++ y ){
        double value = interpolate( x, y, inputs );
        Color color = colorRangeOf( value );
        picture.setPixel( x, y, color );
    }
}

So a picture is created without creating a pixel matrix, grouping colors. The boundary "curves" will automatically be there after each pixel value of the picture is specified.

Xipan Xiao
  • 343
  • 1
  • 10
  • 2
    @JesseJ - You can't comment on others' posts with only 1 reputation point. For that you need at least 50. – beaker Jan 16 '13 at 16:09
  • @xipan-xiao, I dont have problem to generate the bitmap, what I need to figure out is how can i generate the interpolation data with the text marks, and curves. – Tiago Jan 16 '13 at 16:53
  • Tiago, using an inverse d (maybe squared) formula, as posted by @mo-seph, it will make those curves automatically. This is somewhat similar to gravitational and electric field strength problems in physics. You just use the 'force' as the weighting in that area. –  Feb 04 '13 at 23:51