-5

I'd like to capture the output of the following plot to a variable containing a bitmap, in R:

require(stats)
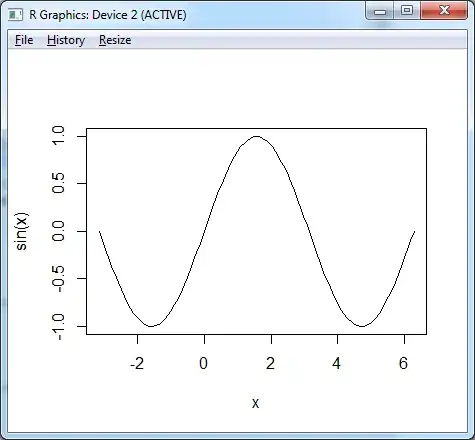
plot(sin, -pi, 2*pi) # see ?plot.function

enter image description here

Contango
  • 76,540
  • 58
  • 260
  • 305
  • Is saving it to a file fine, or do you need C# to grab the data directly e.g. using a pipe. – Paul Hiemstra Jan 17 '13 at 20:04
  • For speed, I would prefer if it didn't involve writes to the hard drive (I'm generating hundreds of these plots). R.NET has excellent support for passing variables back and forth from R to .NET, so if I could capture that bitmap into a variable in R, then we would have a solution. – Contango Jan 17 '13 at 20:06
  • As an aside, the reason I want to do this is that R.NET suppresses graphics output, so I want to capture this plot to a bitmap, and then display from a C# console app using WinForms. As an aside, this technique of capturing a bitmap of a plots perfectly with Mathematica. – Contango Jan 17 '13 at 20:09
  • See http://stackoverflow.com/questions/7144118/how-to-save-a-plot-as-image-on-the-disk – Contango Jan 29 '13 at 16:00

2 Answers2

5

This saves a bitmap file on the harddrive:

bmp("spam.bmp")
plot(sin, -pi, 2*pi)    
dev.off()

Googling R save bitmap get's you this answer.

Paul Hiemstra
  • 59,984
  • 12
  • 142
  • 149
0

Solution with magick package:

img <- magick::image_graph(width = 256, height = 256, res = 96, pointsize = 1, clip = FALSE)
plot(sin, -pi, 2*pi)
dev.off()
img
#>   format width height colorspace matte filesize density
#> 1    PNG   256    256       sRGB  TRUE        0 +72x+72
arr <- magick::image_data(img)
str(arr)
#> num [1:256, 1:256, 1:4] 1 1 1 1 1 1 1 1 1 1 ...
Artem Klevtsov
  • 9,193
  • 6
  • 52
  • 57