13

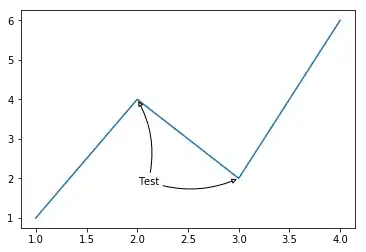
I want to use single annotation text to annotate several data points with several arrows. I made a simple workaround:

ax = plt.gca()
ax.plot([1,2,3,4],[1,4,2,6])
an1 = ax.annotate('Test',
  xy=(2,4), xycoords='data',
  xytext=(30,-80), textcoords='offset points',
  arrowprops=dict(arrowstyle="-|>",
                  connectionstyle="arc3,rad=0.2",
                  fc="w"))
an2 = ax.annotate('Test',
  xy=(3,2), xycoords='data',
  xytext=(0,0), textcoords=an1,
  arrowprops=dict(arrowstyle="-|>",
                  connectionstyle="arc3,rad=0.2",
                  fc="w"))
plt.show()

Producing following result: enter image description here

But I don't really like this solution because it is... well, an ugly dirty hack.

Besides that, it affects the appearance of annotation (mainly if using semi-transparent bboxes etc).

So, if anyone got an actual solution or at least an idea how to implement it, please share.

MnZrK
  • 1,330
  • 11
  • 23
  • It is solved here: https://stackoverflow.com/questions/17414010/how-can-i-have-one-annotation-pointing-to-several-points-in-matplotlib – eln05 Nov 13 '21 at 20:18
  • That's exactly the "solution" that I used in my question. It affects the visual of the text because it dumps the same text in the same place. You can notice it the most if you use semitransparent elements there. – MnZrK Nov 14 '21 at 19:24

2 Answers2

17

I guess the proper solution will require too much effort - subclassing _AnnotateBase and adding support for multiple arrows all by yourself. But I managed to eliminate that issue with second annotate affecting visual appearance simply by adding alpha=0.0. So the updated solution here if no one will provide anything better:

def my_annotate(ax, s, xy_arr=[], *args, **kwargs):
  ans = []
  an = ax.annotate(s, xy_arr[0], *args, **kwargs)
  ans.append(an)
  d = {}
  try:
    d['xycoords'] = kwargs['xycoords']
  except KeyError:
    pass
  try:
    d['arrowprops'] = kwargs['arrowprops']
  except KeyError:
    pass
  for xy in xy_arr[1:]:
    an = ax.annotate(s, xy, alpha=0.0, xytext=(0,0), textcoords=an, **d)
    ans.append(an)
  return ans

ax = plt.gca()
ax.plot([1,2,3,4],[1,4,2,6])
my_annotate(ax,
            'Test',
            xy_arr=[(2,4), (3,2), (4,6)], xycoords='data',
            xytext=(30, -80), textcoords='offset points',
            bbox=dict(boxstyle='round,pad=0.2', fc='yellow', alpha=0.3),
            arrowprops=dict(arrowstyle="-|>",
                            connectionstyle="arc3,rad=0.2",
                            fc="w"))
plt.show()

Resulting picture: enter image description here

MnZrK
  • 1,330
  • 11
  • 23
2

Personally, I would use set axes fraction coordinates to guarantee the placement of the text label, then make all but one label visible by playing with the color keyword argument.

ax = plt.gca()
ax.plot([1,2,3,4],[1,4,2,6])
label_frac_x = 0.35
label_frac_y = 0.2

#label first point
ax.annotate('Test', 
  xy=(2,4), xycoords='data', color='white',
  xytext=(label_frac_x,label_frac_y), textcoords='axes fraction',
  arrowprops=dict(arrowstyle="-|>",
                  connectionstyle="arc3,rad=0.2",
                  fc="w"))

#label second point    
ax.annotate('Test', 
      xy=(3,2), xycoords='data', color='black',
      xytext=(label_frac_x, label_frac_y), textcoords='axes fraction',
      arrowprops=dict(arrowstyle="-|>",
                      connectionstyle="arc3,rad=0.2",
                      fc="w"))
plt.show()

View Example Plot

Lauren Oldja
  • 612
  • 4
  • 11