3

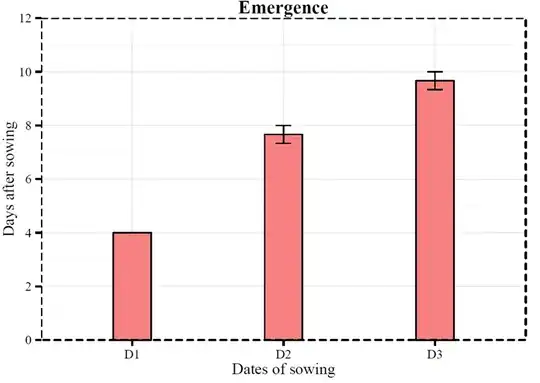
enter image description here

I am using Cairo setting as

CairoPDF(file = "test2.pdf", width = 8.3, height = 11.7) 

and theme setting is like this:

mytheme<-theme_bw() +
         theme(plot.title = element_text(lineheight=.8, face="bold"),
               text=element_text(size=11, family="Times New Roman"))+ 
         theme(panel.border = element_rect(linetype = "dashed", 
                                           colour = "black"))+ 
         theme(plot.margin = unit(c(1,1.5,1,1.5), "inches"))

I guess, this is a problem with my theme setting for ggplot. please give advice to fix it. Thanks.

agstudy
  • 119,832
  • 17
  • 199
  • 261
Barun
  • 185
  • 1
  • 2
  • 10
  • 2
    [How about a reproducible example?](http://stackoverflow.com/questions/5963269/how-to-make-a-great-r-reproducible-example) – Arun Jan 28 '13 at 14:34
  • 1
    Arun is correct. This is pretty sparse info to go on. If you post some sample data and the full plotting code, we can probably give you a better answer. – Dinre Jan 28 '13 at 15:25

3 Answers3

4

Using only theme_bw() I can reproduce the feature.

df <- data.frame(lab = c('D1','D2','D3'),y = c(4,8,10),x= c(1,2,3))
library(Cairo)
#CairoPDF(file = "test2.pdf", width = 8.3, height = 11.7) 
library(grid)
library(ggplot2)
ggplot(df, aes(xmin = x-0.2, xmax = x + 0.2, ymin = 0, ymax = y,fill=lab)) +
  geom_rect()+xlim(labels = as.character(df$lab))+ theme_bw() 
dev.off()

It seems that the combination of Cairo and ggplot2, when we use a theme, creates some rendering problems.

One workaround is to save in simple pdf. I hope that others give a better solution using this reproducible example.

pdf(file = "test2.pdf", width = 8.3, height = 11.7) 
Brian Diggs
  • 57,757
  • 13
  • 166
  • 188
agstudy
  • 119,832
  • 17
  • 199
  • 261
1

This may or may not fix your specific problem, but I often have this issue with 'grid' objects with respect to the pixel scaling. I can frequently fix the problem by slightly reducing or increasing the size of the image.

I would troubleshoot by taking the following steps:

  • Print the object to a screen plotting device, and see if the problem is still there. If not, the problem exists between your plotting device (in memory) and the exporter (CairoPDF). In that case, print to the screen first, and then save the file. Make sure the screen plotting device has the appropriate size.
  • Try adjusting the size of the 'width' and 'height' arguments. If you see the problem changing or others popping up, then you have a problem with scaling between the size of the plotting device and the export file. Make sure you get a pixel-exact match between the two, by using the format of: windows(width=8.3, height=11.7, xpinch=72, ypinch=72) before you print the plot to screen.
  • Test exporting directly to a different format. It may be that the problem is only in the specific exporter. If you can print directly to a PNG file without a problem, then the issue is probably with the way the CairoPDF exporter is working. You may find it easier to simply use the other file format or to manually convert the PNG (or other file) into a PDF using a different program, like LibreOffice or ImageMagick.

Good luck!

Dinre
  • 4,196
  • 17
  • 26
  • may be this problem is due to combination of Cairo and ggplot2. because generic plot function is doing well with CairoPDF. Thanks for your effort. – Barun Jan 28 '13 at 15:49
  • I would also add that lattice graphics, which also rely on grid, work fine. – Johan Larsson Nov 07 '17 at 12:32
0

I have the same problem with bottom and right panel borders becoming thicker when sending the above ggplot example code to svg, pdf, cairo_pdf etc.

Here's a workaround that I use in Inkscape which might give some insight to someone with better understanding of R and pdf/svg rendering:

In Inkscape:

  • select the panel border

  • object > ungroup (do this twice)

  • or keyboard shortcut shift+ctrl+G (x2)

So it seems the panel border is grouped with the panel background. Surprisingly rather than the bottom and right becoming thinner, the top and left become thicker. So actually it looks like OP question should be rephrased to "plotting thinner lines in top and left side of plot".

Jordan
  • 173
  • 1
  • 2
  • 9