19

I'm trying to model a certain flow using graphviz, and I can't figure out how to model the following graph to share the same horizontal center

digraph exmp {
   A -> B -> C -> D
   C -> E [constraint=false]
   A -> C [style="dotted", constraint=false]
   A -> D [style="dotted",  constraint=false]
   B -> D [constraint=false]
   D -> A [style="dashed", constraint=false]
   C -> A [style="dashed", constraint=false]


   subgraph cluster_hackToSinkIt { E -> F }
   { rank="sink" E F }
}

this results in the following graph:

rendered image

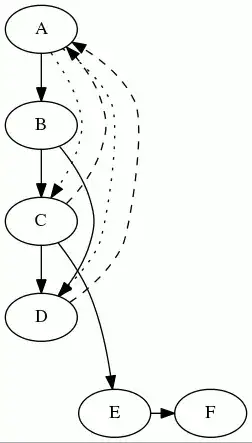
My question is, how can I get the E -> F to be positioned under D such that is lies in the same column?

Zeta
  • 103,620
  • 13
  • 194
  • 236
Davy Landman
  • 15,109
  • 6
  • 49
  • 73

1 Answers1

29

At least as of May 2007, you can't force "columns" per se, but you can apply weight to edges which should help force alignment. But actually, in this case, if you just add an invisible edge from D to E, you've got vertical alignment.

digraph exmp {
    A -> B -> C -> D
    C -> E [constraint=false]
    A -> C [style="dotted", constraint=false]
    A -> D [style="dotted",  constraint=false]
    B -> D [constraint=false]
    D -> A [style="dashed", constraint=false]
    C -> A [style="dashed", constraint=false]
    D -> E [style="invis"] // <---- important new line


    subgraph cluster_hackToSinkIt { E -> F }
    { rank="sink" E F }
}

fixed dot image

I'm not aware of any way to force edges to one side or another.

Zeta
  • 103,620
  • 13
  • 194
  • 236
Mark Rushakoff
  • 249,864
  • 45
  • 407
  • 398
  • I've removed the question about how to force the edges and will create a new question for that. Else it would be hard to judge which answer would be the correct answer. – Davy Landman Sep 25 '09 at 14:00