103

In Firefox I can get the stack trace of an exception by using exception.stack.

Is there a way to get that in other browsers, too?

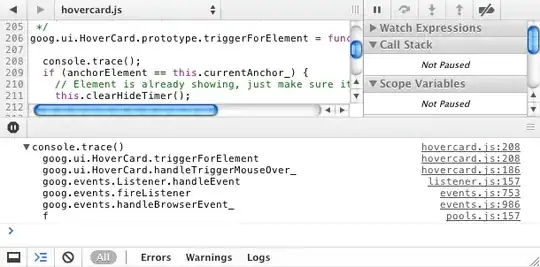
Edit: I actually want to save the stack trace automatically (if possible) and not debug it at the time (i.e. I know how to get the stack trace in a debugger).
ujh
  • 4,023
  • 3
  • 27
  • 31

4 Answers4

89

Place this line where you want to print the stack trace:

console.log(new Error().stack);

Note: tested by me on Chrome 24 and Firefox 18

May be worth taking a look at this tool as well.

Francesco Casula
  • 26,184
  • 15
  • 132
  • 131
  • 2
    Sweet - I use a combination of onerror to get the line number and then wrap the offending line with a try catch and your suggestion to alert the stacktrace back to the user. ` window.onerror = function(message, url, lineNumber) { alert('message: ' + message + ' - url: ' + url + ' - ln: ' + lineNumber); return true; }; ` Then wrap it to print out the stacktrace. ` try { // Some code that is causing the exception. } catch(e) { alert(new Error().stack); } ` – Philip Murphy Feb 01 '13 at 09:43
  • somehow dies only gives me the first line of the stack. What am I doing wrong?? i.e.: function foo() { fdasmkl } try { foo() } catch(e) { err = new Error(e).stack; console.log(err) } =>>> `Error: ReferenceError: fdasmkl is not defined at :6:7` instead of `"Error: ReferenceError: fdasmkl is not defined at eval (eval at (:6:1), :1:1) at :6:1"` – chitzui Oct 21 '19 at 11:49
  • nevermind, found the issue. Since it was an error already, I can do: `function foo() { fdasmkl } try { foo() } catch(e) { console.log(e.stack) }` immediately – chitzui Oct 21 '19 at 11:53
23

Webkit now has functionality that provides stack traces:

Web Inspector: Understanding Stack Traces, posted by Yury Semikhatsky on Wednesday, April 20th, 2011 at 7:32 am (webkit.org)

From that post:

Community
  • 1
  • 1
Brian M. Hunt
  • 81,008
  • 74
  • 230
  • 343
3

If you want the string stack trace, I'd go with insin's answer: stacktrace.js. If you want to access the pieces of a stacktrace (line numbers, file names, etc) stackinfo, which actually uses stacktrace.js under the hood.

reubano
  • 5,087
  • 1
  • 42
  • 41
B T
  • 57,525
  • 34
  • 189
  • 207
0

Not really, at least not easily.

In IE, you can debug the browser process with MS Script Debugger (which for some reason is an Office component) or Visual Studio, and then you can see the stack on breakpoints.

levik
  • 114,835
  • 27
  • 73
  • 90