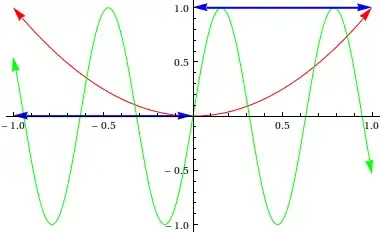
I'm trying to figure out how to draw lines with widths in data units. For example, in the following code snippet, I would want the horizontal part of the line of width 80 to always extend from the y=-40 to the y=+40 mark, and stay that way even if the limits of the coordinate system change. Is there a way to achieve this with Line2D objects in matplotlib? Any other way to get a similar effect?
from pylab import figure, gca, Line2D

figure()
ax = gca()
ax.set_xlim(-50, 50)
ax.set_ylim(-75, 75)

ax.add_line(Line2D([-50, 0, 50], [-50, 0, 0], linewidth=80))

ax.grid()

