2
> d
         [,1]        [,2]
1  -0.5561835  1.49947588
2  -2.3985544  3.07130217
3  -3.8833659 -4.29331711
4   3.1025836  5.45359160
5   0.7438354 -2.80116065
6   7.0787294 -2.78121213
7  -1.6633598 -1.17898157
8  -0.6751930  0.03466162
9   1.4633841  0.50173157
10 -3.2118758  0.49390863

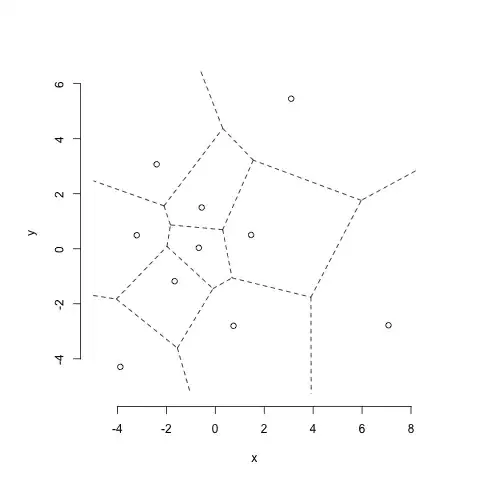
The above table gives the x(1st column) and y(2nd column) coordinates of the plot i want to plot.

require(MASS)               # for sammon using which i generated the above coordinates
require(deldir)             # for voronoi tessellations
dd <- deldir(d[,1], d[,2])  # voronoi tessellations
plot(dd,wlines="tess")      # This will give me tessellations

I want my next tessellations to be plotted in one region in the above tessellation. I can get the lines that form the tessellations using dd$dirsgs. In this each line that is there in the tessellation is given with their end points. The first four columns of this gives the x1,y1 and x2,y2 coordinates respectively. These coordinates are the end points of the line. Using this data can I plot the next sub-tessellation within this one region in the above tessellation.

For the next sub-tessellation, you can generate the coordinates of your choice. But I just want them to be in one region of the above plotted tessellation.

ind 1 and ind2 in the dd$dirsgs gives the points in 'd' which are separated by the line represented by the first 4 columns of dd$dirsgs.

For example, if we want to plot the sub-tessellation in the plot containing the first point in d, then the rows 1,2,9,12,17 are the rows that form the boundary for the first point in d. Using this information, can we plot the sub-tessellation within this region? –

I think I have covered all the things that are requisite to understand my problem. If there is any more data which I have not included then please let me know. I will give the information.

dp758
  • 106
  • 10
  • 1
    I think the answer lies in passing the bounds to the mar field. mar= c(-10,-10,10,10) makes a region bound between -10 & 10 on both axii. So if we could pass functions of coordinates, e.g. c(3-y,4-x,6+x,2+y), it could produce a bound between lines x+y=3, x+y=4, y-x=6 and x-y=2. – jackStinger Feb 12 '13 at 13:42
  • 1
    mar parameter of par function gives a rectangle as a bound but in the above tessellations i can have 5 or more lines forming the boundary of a particular region. I also used 'subplot' function of 'TeachingDemos' package but couldn't apply it in my case. You can also try 'subplot' and see if you guys find anything – dp758 Feb 12 '13 at 13:47
  • Have you tried mar with less than 4 variables? I believe it might go till infinity. If that happens, then it might accept more as well. Give it a shot! – jackStinger Feb 12 '13 at 14:18

2 Answers2

2

The way I understand it (and by that I mean if i understood correctly your question), because plot.deldir allows an argument add=TRUE to be passed, it can be done directly.

d<-structure(list(V1 = c(-0.5561835, -2.3985544, -3.8833659, 3.1025836, 0.7438354, 
                  7.0787294, -1.6633598, -0.675193, 1.4633841, -3.2118758), V2 = 
                  c(1.49947588, 3.07130217, -4.29331711, 5.4535916, -2.80116065, 
                  -2.78121213, -1.17898157, 0.03466162, 0.50173157, 0.49390863)), .Names =        
                  c("V1","V2"), class = "data.frame", row.names = c(NA, -10L))

library(MASS)
library(deldir)
dd <- deldir(d[,1], d[,2])
plot(dd, wlines="tess")

enter image description here

First let's extract the data for the polygon: as you noticed in the comments it need more processing that i previously thought since the polygons in plot.deldir are plotted line by line and not polygon after polygon so the order of the lines is scrambled in dd$dirsgs.

ddd <- as.matrix(dd$dirsgs[dd$dirsgs$ind2==1,1:4])
d1poly <- rbind(ddd[1,1:2],ddd[1,3:4])
for( i in 2:nrow(ddd)){
    x <- ddd[ddd[,1]==d1poly[i,1], 3:4]
    d1poly <- rbind(d1poly, x)
    }
d1poly
         x2       y2
  -2.096990 1.559118
   0.303986 4.373353
x  1.550185 3.220238
x  0.301414 0.692558
x -1.834581 0.866098
x -2.096990 1.559118

Let's create some random data in the polygon of interest using package splancs:

library(splancs)
rd <- csr(as.matrix(d1poly),10) # For 10 random points in the polygon containing point 1
rd
              xc        yc
 [1,] -1.6904093 1.9281052
 [2,] -1.1321334 1.7363064
 [3,]  0.2264649 1.3986126
 [4,] -1.1883844 2.5996515
 [5,] -0.6929208 0.8745020
 [6,] -0.8348241 2.3318222
 [7,]  0.9101748 1.9439797
 [8,]  0.1665160 1.8754703
 [9,] -1.1100710 1.3517257
[10,] -1.5691826 0.8782223

rdd <- deldir(c(rd[,1],d[1,1]),c(rd[,2],d[1,2])) 
# don't forget to add the coordinates of your point 1 so it s part of the sub-tessellation
plot(dd, wlines="tess")
plot(rdd, add=TRUE, wlines="tess")

enter image description here

Edit
Concerning restricting the lines within the boundary, the only solution I can think of is a very ugly workaround: drawing first the subtesselation, then hiding the outside of the polygon of interest and then plotting the global tesselation.

plot(dd, wlines="tess", col="white", wpoints="none")
plot(rdd, wlines="tess", add=TRUE)

plotlim <- cbind(par()$usr[c(1,2,2,1)],par()$usr[c(3,3,4,4)])
extpoly <- rbind(plotlim, d1poly) 
#Here the first point of d1poly is oriented toward the upper left corner: if it is oriented otherwise the order of plotlim has to be changed accordingly

polygon(extpoly, border=NA, col="white")

plot(dd, wlines="tess", add=TRUE)

enter image description here

plannapus
  • 18,529
  • 4
  • 72
  • 94
  • Thanks plannapus :) There are some more constraints in my problem...But using the information you have given I think i should find the solution...I will do some more work on this and if I have any problem I will let you know. – dp758 Feb 13 '13 at 06:23
  • Is there a way to restrict the lines of the tessellation within the boundary. I dont want them to go out of the boundary – dp758 Feb 13 '13 at 08:12
  • @Chetan I'm trying to find a way but there is nothing obvious that comes to mind. I'll go back to you if I do find something – plannapus Feb 13 '13 at 08:25
1

You may instead want to consider using the spatstat package for this, as it can greatly simplify constraining the new tessellation to a tile of the existing tessellation. Your setup will then look like this:

library(spatstat)
# Plot the main tessellation and points
d<-structure(list(V1 = c(-0.5561835, -2.3985544, -3.8833659, 3.1025836, 0.7438354, 
                  7.0787294, -1.6633598, -0.675193, 1.4633841, -3.2118758), V2 = 
                  c(1.49947588, 3.07130217, -4.29331711, 5.4535916, -2.80116065, 
                  -2.78121213, -1.17898157, 0.03466162, 0.50173157, 0.49390863)), .Names =        
                  c("V1","V2"), class = "data.frame", row.names = c(NA, -10L))

d_points <- ppp(d$V1, d$V2, window=owin(c(-5, 8), c(-6, 6)))
main_tessellation <- dirichlet(d_points)
plot(main_tessellation, lty=3) # plot the tessellation
plot(d_points, add=TRUE) # add the points

# Plot the interior tessellation and points (color=red so the difference is clear)
# Arbitrarily choosing the 9th tile from the above tessellation:
target_poly <- owin(poly=main_tessellation$tiles[[9]]$bdry[[1]])

# Generate random set of points within the boundaries of the polygon chosen above
new_points <- runifpoint(6, win=target_poly)
# Generate and plot the new tessellation and points
new_tessellation <- dirichlet(new_points)
plot(new_tessellation, add=TRUE, col='red')
plot(new_points, add=TRUE, col='red')

Which will produce: enter image description here

See this closely related question: Voronoi diagram polygons enclosed in geographic borders

Community
  • 1
  • 1
Bryan
  • 1,771
  • 4
  • 17
  • 30