Given this datafile:
Sunrise cat 1
Sunset dog 2
Sunrise fish 3
waste space 4
blah blah 5
Sunrise label 6
we can plot it with this line:
plot 'test.dat' u 3:xticlabels(strcol(1) eq 'Sunrise'?strcol(1).strcol(2):'')
And it creates this plot:

Basically what I did there is I looked at the string in column 1, if it is "Sunrise", I concatenated it with the string in column 2. If it isn't "Sunrise", then I return an empty string to prevent a label from being placed there. This does however, place a major tic at the location of each data point. To avoid that, you can use the following:
plot 'test.dat' u 3:xticlabels(strcol(1) eq 'Sunrise'?strcol(1).strcol(2):NaN)
which produces this plot (I've tested on gnuplot 4.4.2 and 4.6.0):
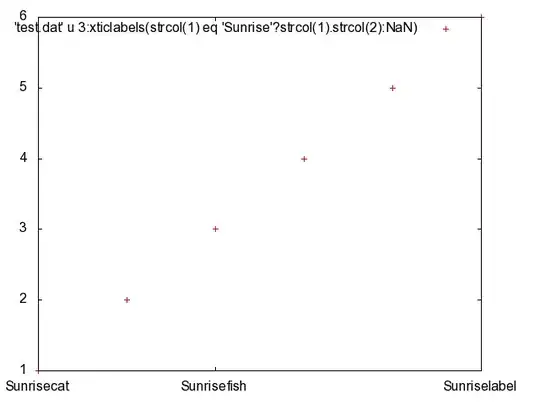
It also issues a bunch of warnings about non-string labels, but I guess that's OK.