Is it possible in springframework to log the time taken by methods [ selective | all ] automatically. By automatically i mean, i don't want to go to each method and write the log.debug ( "...." ); stuff.
Asked
Active
Viewed 1.3k times
5 Answers
17
AOP is what you need here. AOP allows you to add code to your application without modifying the original code. Spring AOP prefers to accomplish this with Proxy objects. Proxy objects use a Decorator Pattern to wrap the original Target object and add code. The Proxy is configured to implement one or more interfaces of the original Target object.
Here, to time an application, the idea is to use the PerformanceMonitorInterceptor, one of the performance monitoring classes that ship with the Spring Framework.
The first option is to use the Spring class ProxyFactoryBean to create Spring AOP Proxy objects. To do this:
- Define your original bean:
- Define a
PerformanceMonitorInterceptor: - Define a
RegexpMethodPointcutAdvisor: - Define a
ProxyFactoryBeanto proxy your original bean and apply your Advisor - Set the Log level for the
PerformanceMonitorInterceptorto TRACE
Below a Spring configuration that illustrates these steps:
<beans>
  <bean id="MyServiceTarget" class="org.myapp.services.MyService">
    <property ... />
  </bean>

  <bean id="timingLogger" class="org.springframework.aop.interceptor.PerformanceMonitorInterceptor"/>

  <bean id="timingAdvisor" class="org.springframework.aop.support.RegexpMethodPointcutAdvisor">
    <property name="advice" ref="timingLogger"/>
    <property name="patterns">
      <list>
        <value>.*</value>
      </list>
    </property>
  </bean>

  <bean id="MyService" class="org.springframework.aop.framework.ProxyFactoryBean">
    <property name="proxyInterfaces">
      <value>org.myapp.services.MyService</value>
    </property>
    <property name="target"><ref local="MyServiceTarget"/></property>
    <property name="interceptorNames">
      <list>
        <value>timingAdvisor</value>
      </list>
    </property>
  </bean>
</beans>
And the configuration of the Log level for the PerformanceMonitorInterceptor:
log4j.logger.org.springframework.aop.interceptor.PerformanceMonitorInterceptor=TRACE
Starting with Spring 2.0, there is another option: using Spring 2.0 XML Schema-based configuration and Spring's AspectJ style pointcut expressions. With the ProxyFactoryBean you have to explicitly declare the interfaces you want to proxy; using the <aop:config> and <aop:advisor> tags, you can automatically proxy every interface of every object in the bean container.
<beans "add xsd declarations here" >
  <bean id="MyService" class="org.myapp.services.MyService">
    <property ... />
  </bean>

  <bean id="timingAdvice"
class="org.springframework.aop.interceptor.PerformanceMonitorInterceptor"/>

  <aop:config>
    <aop:advisor pointcut="execution(* org.myapp.services.MyService.*(..))"
      advice-ref="timingAdvice"/>
  </aop:config>
</beans>
Pascal Thivent
- 562,542
- 136
- 1,062
- 1,124
-
I don't know why but it is not working.Also edit you code from *
* to * – Rakesh Juyal Sep 30 '09 at 06:36* -
just it is not logging anything, i added the line u specified to enable the TRACE, that thing didn't worked out. Then i deleted my existing log4j prop and created a new one with everthing you mentiond, even then i am not getting anything in log. :| – Rakesh Juyal Sep 30 '09 at 06:58
-
2That configuration snippet on its own will not do anything. You need to declare a Spring AOP BeanPostProcessor (or is it a BeanFactoryPostProcessor) to auto-proxy the beans with the timingAdvisor. – skaffman Sep 30 '09 at 07:20
-
I've updated my answer to detail how to proxy Spring beans with the `ProxyFactoryBean` – Pascal Thivent Oct 01 '09 at 10:38
4
You can take a look at stagemonitor. It is a open source java web application performance monitor. It captures response time metrics, JVM metrics, request details (including a call stack captured by the request profiler) and more. The overhead is very low.
Optionally, you can use the great timeseries database graphite with it to store a long history of datapoints that you can look at with fancy dashboards.
Example Screenshot:
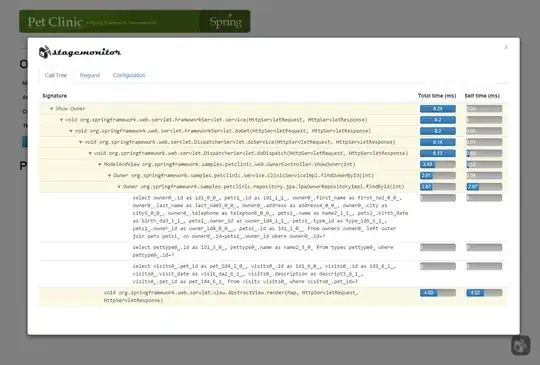
Take a look at the project website to see more screenshots, feature descriptions and documentation.
Note: I am the developer of stagemonitor
Felix
- 5,804
- 4
- 25
- 37
2
Finally i figured out how to do this.
First of all see the post by 'Pascal Thivent', it did a great help to me. After changing your log4j.properties and creating the timingAdvisor what you have to is, binding this adviser to the class you wan to enable the debugging. You have to change your code like this.
earlier code:
<bean id="myTableDao" class="com.xyz.sc.db.dao.MyTableDaoImpl" parent="commonDataSource" >
            <property name="anotherDao" ref="anotherDao"/>
    </bean>
New code.
<bean id="myTableDaoTarget" class="com.xyz.sc.db.dao.MyTableDaoImpl" parent="commonDataSource" >
        <property name="anotherDao" ref="anotherDao"/>
</bean>


    <bean id="myTableDao" class="org.springframework.aop.framework.ProxyFactoryBean">
    <property name="proxyInterfaces">
        <value>com.xyz.sc.db.dao.MyTableDao</value>
    </property>
    <property name="target"><ref local="myTableDaoTarget"/></property>
    <property name="interceptorNames">
        <list>
            <value>timingAdvisor</value>
        </list>
    </property>
</bean>
Rakesh Juyal
- 35,919
- 68
- 173
- 214
1
You can use AspectJ for this, declare a log pointcut called by wildcard with pre- and post handling by before() and after() advice.
Arne Burmeister
- 20,046
- 8
- 53
- 94
1
I see that there has already been an accepted answer here, but I'd encourage everyone to take a look at the latest release of Spring Toolsuite (SpringSource's distro of Eclipse). It comes with a profiling utility out of the box, Spring Insight, that provides these exact statistics at runtime in a nice format. Just deploy your app to its internal tomcat, hit a few pages, then go to the /insight servlet and see the time taken in each method called all the way down to the SQL statements that were executed and how long they took.
Here's a link to a nice writeup about Spring Insight that should get you what you want in just a few minutes. http://www.dotkam.com/2009/10/28/spring-insight-in-action-5-minutes-from-scratch/