0

Assuming i have a dataframe of x , y , z wherein x any y are the coordinates and z is the height. How do I create a blanket of z over the x and y plane. I tried using the loess function to create a blanket

data.loess = loess(z~x*y,data =data.df)
data.fit = expand.grid(list(x = seq(min(x),max(x),0.1), y = seq(min(y),max(y),0.1)))
z = predict(data.loess, newdata =data.fit)

But the predicted z value is not in coherence with the original height.

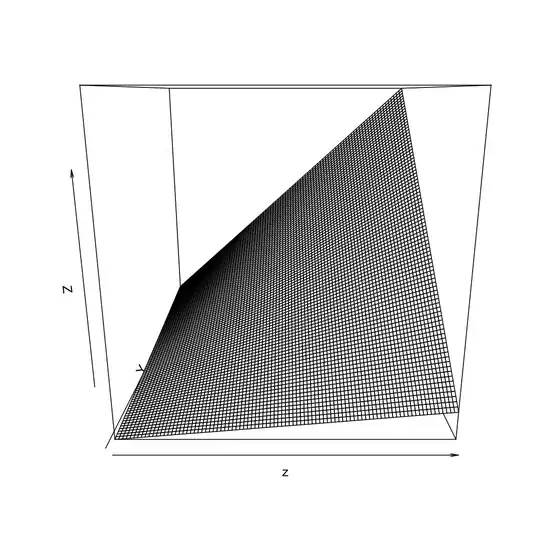
Functions like scatterplot3d gives me only the scattered dots,how do I get a surface with hills and valley?

Sri
  • 1
  • 1
  • 3
  • 1
    possible duplicate of [R: Plotting a 3D surface from x, y, z](http://stackoverflow.com/questions/3979240/r-plotting-a-3d-surface-from-x-y-z) – juba Feb 22 '13 at 08:22
  • That will give me spikes and not smooth curve rep hills and valley – Sri Feb 22 '13 at 08:28
  • @Sri It sounds like you need to adjust the parameters of the `loess` approximation to get smoother predictions. You could start with `span`. – James Feb 22 '13 at 09:20

1 Answers1

1

I have no idea what the phrase "not in coherence with original height" means, but why not look at:

persp(z)

x = seq(1,10,0.1); y = seq(1,10,0.1)
z= outer(x,y,"*")
data =data.frame(x=rep(x, times=91), y=rep(y, each=91), z=c(z) )
data.loess = loess(z~x*y,data =data)
data.fit = expand.grid(list(x = seq(min(x),max(x),0.1), y = seq(min(y),max(y),0.1)))
z = predict(data.loess, newdata =data.fit)
persp(z)

enter image description here

IRTFM
  • 258,963
  • 21
  • 364
  • 487