1

I'm trying to create some code in Swing/JPanel that takes some (changable) variables and draws a graph like this:

image

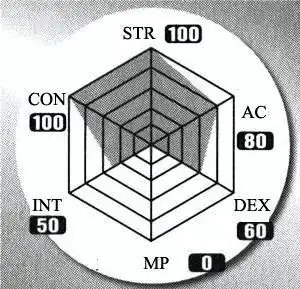
I have no idea where to start. The idea is there would be key points on the hexagon, one for each variable, and a line would be draw between each point, and then the space inside the custom shape would be shaded in. Any ideas?

Code Prototype

import java.awt.*;
import javax.swing.*;

public class DrawPolygon extends JPanel {

int xOffset = 0;
int yOffset = 0;
int sizeModifer = 50;
int numOfPoints = 8;
int linePosition = 80;
double sizeMultiplier = 1;

@Override
public void paintComponent(Graphics g) {
    super.paintComponent(g);

    Polygon[] polygons = new Polygon[5];
    for (int i = 0; i < polygons.length; i++){
        polygons[i] = new Polygon();
        for (int q = 0; q < numOfPoints; q++) {
            polygons[i].addPoint(
                xOffset + (int) (linePosition + (sizeModifer*sizeMultiplier)
                * Math.cos(q * 2 * Math.PI / numOfPoints)),
                yOffset + (int) ((linePosition - 10) + (sizeModifer*sizeMultiplier)
                * Math.sin(q * 2 * Math.PI / numOfPoints)));
        }//built points
        sizeMultiplier = sizeMultiplier - 0.2;
    }//build polygon arrays

    Polygon innerPolygon = new Polygon();
    for (int i = 0; i < numOfPoints; i++) {
        int randomRange = 5 + (int) (Math.random() * ((sizeModifer - 5) + 1));
        innerPolygon.addPoint(
            xOffset + (int) (linePosition + randomRange
            * Math.cos(i * 2 * Math.PI / numOfPoints)),
            yOffset + (int) ((linePosition - 10) + randomRange
            * Math.sin(i * 2 * Math.PI / numOfPoints)));
    }
    Graphics2D g2d = (Graphics2D) g;
    g2d.setRenderingHint(
        RenderingHints.KEY_ANTIALIASING,
        RenderingHints.VALUE_ANTIALIAS_ON);
    g2d.setStroke(new BasicStroke(1));

    for (int i = 0; i < polygons.length; i++){
        g2d.setColor(Color.green);
        g2d.fill(polygons[i]);
        g2d.setColor(Color.black);
        g2d.draw(polygons[i]);
    }//draw polygons from arrays

    double distanceModifier = 1;
    for (int i = 0; i < numOfPoints; i++) {
        g2d.drawString("test"+(i+1),
            xOffset + (int) (linePosition + (sizeModifer*distanceModifier)
            * Math.cos(i * 2 * Math.PI / numOfPoints)),
            yOffset + (int) ((linePosition - 10) + (sizeModifer*distanceModifier)
            * Math.sin(i * 2 * Math.PI / numOfPoints)));
        distanceModifier = distanceModifier +.01;
    }

    g2d.setColor(new Color(255,213,200,90));
    g2d.fill(innerPolygon);
    g2d.setColor(Color.red);
    g2d.draw(innerPolygon);
}

@Override
public Dimension getPreferredSize() {
    // TODO calculate size based on geometry
    return new Dimension(160, 160);
}

public static void main(String[] args) {
    EventQueue.invokeLater(new Runnable() {
        @Override
        public void run() {
            JFrame frame = new JFrame();
            frame.setDefaultCloseOperation(JFrame.EXIT_ON_CLOSE);
            frame.setTitle("Show Different Polygons");
            frame.add(new DrawPolygon());
            frame.pack();
            frame.setLocationByPlatform(true);
            frame.setVisible(true);
        }
    });
}

}

Community
  • 1
  • 1
NekoLLX
  • 219
  • 6
  • 19
  • 2
    Assuming you have a grasp of customing painting, start with [2D Graphics](http://docs.oracle.com/javase/tutorial/2d/index.html), otherwise start with [Custom Pinting](http://docs.oracle.com/javase/tutorial/uiswing/painting/) – MadProgrammer Feb 23 '13 at 20:52
  • +1 for [sscce](http://sscce.org/). – trashgod Feb 24 '13 at 14:55

3 Answers3

5

JFreeChart includes a SpiderWebPlot, pictured in the demo under Miscellaneous and discussed here. While SpiderWebChartDemo1 contains five categories, your image appears to contain six.

image

trashgod
  • 203,806
  • 29
  • 246
  • 1,045
3

Sure. I'm sure there must be Java libraries to do this already; for example, Sonar shows a diagram similar to this. It's usually preferable to use someone else's component instead of writing your own where possible. Usually I would use JFreeChart, but it looks like that doesn't have such a component.

If you want to write your own, you just have to do some simple calculations of where each point on the web would be. From the center, you would start by drawing a line at 0 degrees. Then each subsequent radial line would be rotated by 2*pi/n radians. You can apply some simple trigonometry to figure out the Cartesian (x, y) coordinates from the angles and the radius of each hexagon. Finally, you would overlay the filled area. So an algorithm might be something like this. In the following pseudocode, the parameter values is a list of small positive integers representing each point on the polygon as an offset from the center of the diagram. For a hexagon, therefore, you would have six values in this list.

function drawGraph(values):

    steps = maximum value from values
    lines = number of values

    webWidth = min(width, height)
    centerX = width / 2
    centerY = height / 2

    // Draw lines

    for radialLineNumber in 0..lines:
        angle = radialLineNumber * 2 * pi / lines;
        draw line from (centerX, centerY) to (centerX + cos(angle)*webWidth, centerY + sin(angle) * webWidth))
        edgePolygon = blank polygon
        for edgeNumber in 1..steps:
            x = centerX + cos(angle) * webWidth * edgeNumber / steps
            y = centerY + sin(angle) * webWidth * edgeNumber / steps
            add (x, y) to edgePolygon
        stroke polygon edgePolygon

    // Draw polygon

    areaPolygon = blank polygon
    radialLineNumber = 0
    for value in values:
        angle = radialLineNumber * 2 * pi / lines;
        x = centerX + cos(angle) * value * webWidth / steps
        y = centerY + sin(angle) * value * webWidth / steps
        add (x, y) to areaPolygon
    fill polygon areaPolygon

I'll leave it to you to translate this pseudocode into a real JComponent. All of the functions I have used are either on Math or Graphics2D. You may want to set the opacity of the area polygon before drawing it.

Eric Galluzzo
  • 3,191
  • 1
  • 20
  • 20
  • Ok between your psydo code and some google fu i came up with something, BUT I can't seem to draw the interior polygon, right now I'm using random numbers to generate the interior but not generating any secondary poly gone – NekoLLX Feb 24 '13 at 05:19
  • @EricG: I've elaborated [here](http://stackoverflow.com/a/15052943/230513) on the proposed implementation. For reference, the [`SpiderWebPlot`](http://www.jfree.org/jfreechart/api/javadoc/org/jfree/chart/plot/SpiderWebPlot.html) source may be seen [here](http://www.jfree.org/jfreechart/api/javadoc/src-html/org/jfree/chart/plot/SpiderWebPlot.html). – trashgod Feb 24 '13 at 15:00
2

A few notes on your example:

  • Use the features of Graphics2D to render your Polygon, which implements Shape.

  • Override getPreferredSize(), as discussed here.

  • Swing GUI objects should be constructed and manipulated only on the event dispatch thread.

image

import java.awt.*;
import javax.swing.*;

public class DrawPolygon extends JPanel {

    int xOffset = 0;
    int yOffset = 0;
    int sizeModifer = 50;
    int numOfPoints = 8;
    int linePosition = 80;

    @Override
    public void paintComponent(Graphics g) {
        super.paintComponent(g);
        Polygon outerPolygon = new Polygon();
        for (int i = 0; i < numOfPoints; i++) {
            outerPolygon.addPoint(
                xOffset + (int) (linePosition + sizeModifer
                * Math.cos(i * 2 * Math.PI / numOfPoints)),
                yOffset + (int) ((linePosition - 10) + sizeModifer
                * Math.sin(i * 2 * Math.PI / numOfPoints)));
        }
        Graphics2D g2d = (Graphics2D) g;
        g2d.setRenderingHint(
            RenderingHints.KEY_ANTIALIASING,
            RenderingHints.VALUE_ANTIALIAS_ON);
        g2d.setColor(Color.cyan);
        g2d.fill(outerPolygon);
        g2d.setStroke(new BasicStroke(2));
        g2d.setColor(Color.red);
        g2d.draw(outerPolygon);
    }

    @Override
    public Dimension getPreferredSize() {
        // TODO calculate size based on geometry
        return new Dimension(160, 160);
    }

    public static void main(String[] args) {
        EventQueue.invokeLater(new Runnable() {
            @Override
            public void run() {
                JFrame frame = new JFrame();
                frame.setDefaultCloseOperation(JFrame.EXIT_ON_CLOSE);
                frame.setTitle("Show Different Polygons");
                frame.add(new DrawPolygon());
                frame.pack();
                frame.setLocationByPlatform(true);
                frame.setVisible(true);
            }
        });
    }
}

Addendum: Based on comments, this revision restores the original innerPolygon.

import java.awt.*;
import javax.swing.*;

public class DrawPolygon extends JPanel {

    int xOffset = 0;
    int yOffset = 0;
    int sizeModifer = 50;
    int numOfPoints = 8;
    int linePosition = 80;

    @Override
    public void paintComponent(Graphics g) {
        super.paintComponent(g);
        Polygon outerPolygon = new Polygon();
        for (int i = 0; i < numOfPoints; i++) {
            outerPolygon.addPoint(
                xOffset + (int) (linePosition + sizeModifer
                * Math.cos(i * 2 * Math.PI / numOfPoints)),
                yOffset + (int) ((linePosition - 10) + sizeModifer
                * Math.sin(i * 2 * Math.PI / numOfPoints)));
        }
        Polygon innerPolygon = new Polygon();
        for (int i = 0; i < numOfPoints; i++) {
            int randomRange = 5 + (int) (Math.random() * ((sizeModifer - 5) + 1));
            innerPolygon.addPoint(
                xOffset + (int) (linePosition + randomRange
                * Math.cos(i * 2 * Math.PI / numOfPoints)),
                yOffset + (int) ((linePosition - 10) + randomRange
                * Math.sin(i * 2 * Math.PI / numOfPoints)));
        }
        Graphics2D g2d = (Graphics2D) g;
        g2d.setRenderingHint(
            RenderingHints.KEY_ANTIALIASING,
            RenderingHints.VALUE_ANTIALIAS_ON);
        g2d.setStroke(new BasicStroke(2));
        g2d.setColor(Color.cyan);
        g2d.fill(outerPolygon);
        g2d.setColor(Color.red);
        g2d.draw(outerPolygon);
        g2d.setColor(Color.blue);
        g2d.fill(innerPolygon);
        g2d.setColor(Color.red);
        g2d.draw(innerPolygon);
    }

    @Override
    public Dimension getPreferredSize() {
        // TODO calculate size based on geometry
        return new Dimension(160, 160);
    }

    public static void main(String[] args) {
        EventQueue.invokeLater(new Runnable() {
            @Override
            public void run() {
                JFrame frame = new JFrame();
                frame.setDefaultCloseOperation(JFrame.EXIT_ON_CLOSE);
                frame.setTitle("Show Different Polygons");
                frame.add(new DrawPolygon());
                frame.pack();
                frame.setLocationByPlatform(true);
                frame.setVisible(true);
            }
        });
    }
}
Community
  • 1
  • 1
trashgod
  • 203,806
  • 29
  • 246
  • 1,045
  • Optimized code is always welcome, but looking over your modifications I'm not really seeing anything unfamiliar in fact it looks like you removed some code, in particular the second polygon creation which is why my real problem lies, I can't seem to build a Polygon insde the main one to represet the shaded area as prtotyped by the gfx. A shaded polygon isn't my problem it's a Shaded Polygon INSIDE another polygon that's got me stumped. – NekoLLX Feb 24 '13 at 20:36
  • Ah, I see; the [`SpiderWebPlot`](http://www.jfree.org/jfreechart/api/javadoc/src-html/org/jfree/chart/plot/SpiderWebPlot.html) uses `setComposite()` to get a translucent effect . – trashgod Feb 24 '13 at 23:36
  • That did wonders! Now I've tinkered around to create the the "Rims" in the prototype by putting everything but the random box into a array of pologons but that somehow broke them all any iea how? (see editied topic) – NekoLLX Feb 25 '13 at 03:53
  • I see that each `polygons[i].getBounds()` has `width=0,height=0`. – trashgod Feb 25 '13 at 11:05
  • hum all i did was make a loop out of the former OuterPolygon, and there was no bounds set for that. do i just need to add to the loop polygons[x].setBounds(1,1); or something? – NekoLLX Feb 26 '13 at 21:45
  • No, the bounds are inferred from the polygon's vertices; they are identical, so the interior is empty. – trashgod Feb 26 '13 at 22:51
  • Thanks Trans god, found the problem it was my i viarable in the x offsent i should have been using the q incrementor not the i index. Getting very close now now i just need to bisext the polygons with a line (as per the mock up) and draw text/numbers on the outside points. I know there is DrawString but do i need a new class or do i just create a new polygon larger then the others and do DrawString on that? – NekoLLX Mar 01 '13 at 01:42
  • You can use `drawString()`, for [example](http://stackoverflow.com/a/11924118/230513), but [tag:jfreechart] does all this for you. – trashgod Mar 01 '13 at 04:34
  • yeah after i went home (where i had no internet for the last couple days) i figured it out, so i now i have the text on the graph just need to figure out the best way to get it to line up right – NekoLLX Mar 01 '13 at 20:18