32

Here's the problem:

the memory usage balloons out of control

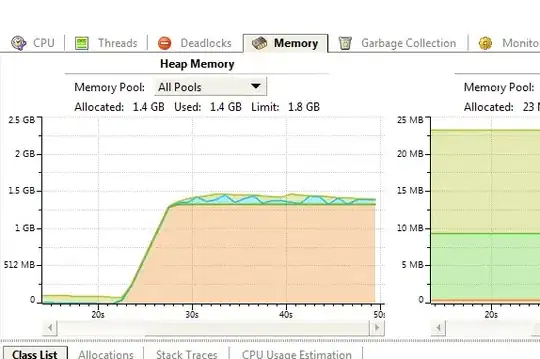
As you can see, the memory usage balloons out of control! I've had to add arguments to the JVM to increase the heapsize just to avoid out of memory errors while I figure out what's going on. Not good!

Basic Application Summary (for context)

This application is (eventually) going to be used for basic on screen CV and template matching type things for automation purposes. I want to achieve as high of a frame rate as possible for watching the screen, and handle all of the processing via a series of separate consumer threads.

I quickly found out that the stock Robot class is really terrible speed wise, so I opened up the source, took out all of the duplicated effort and wasted overhead, and rebuilt it as my own class called FastRobot.

The Class' Code:

public class FastRobot {
    private Rectangle screenRect;
    private GraphicsDevice screen;
    private final Toolkit toolkit;
    private final Robot elRoboto;
    private final RobotPeer peer;
    private final Point gdloc;
    private final DirectColorModel screenCapCM;
    private final int[] bandmasks;

    public FastRobot() throws HeadlessException, AWTException {
        this.screenRect = new Rectangle(Toolkit.getDefaultToolkit().getScreenSize());
        this.screen = GraphicsEnvironment.getLocalGraphicsEnvironment().getDefaultScreenDevice();
        toolkit = Toolkit.getDefaultToolkit();
        elRoboto = new Robot();
        peer = ((ComponentFactory)toolkit).createRobot(elRoboto, screen);

        gdloc = screen.getDefaultConfiguration().getBounds().getLocation();
        this.screenRect.translate(gdloc.x, gdloc.y);

        screenCapCM = new DirectColorModel(24,
                /* red mask */    0x00FF0000,
                /* green mask */  0x0000FF00,
                /* blue mask */   0x000000FF);
        bandmasks = new int[3];
        bandmasks[0] = screenCapCM.getRedMask();
        bandmasks[1] = screenCapCM.getGreenMask();
        bandmasks[2] = screenCapCM.getBlueMask();

        Toolkit.getDefaultToolkit().sync();
    }

    public void autoResetGraphicsEnv() {
        this.screenRect = new Rectangle(Toolkit.getDefaultToolkit().getScreenSize());
        this.screen = GraphicsEnvironment.getLocalGraphicsEnvironment().getDefaultScreenDevice();
    }

    public void manuallySetGraphicsEnv(Rectangle screenRect, GraphicsDevice screen) {
        this.screenRect = screenRect;
        this.screen = screen;
    }


    public BufferedImage createBufferedScreenCapture(int pixels[]) throws HeadlessException, AWTException {
//      BufferedImage image;
        DataBufferInt buffer;
        WritableRaster raster;

        pixels = peer.getRGBPixels(screenRect);
        buffer = new DataBufferInt(pixels, pixels.length);

        raster = Raster.createPackedRaster(buffer, screenRect.width, screenRect.height, screenRect.width, bandmasks, null);
        return new BufferedImage(screenCapCM, raster, false, null);
    }

    public int[] createArrayScreenCapture() throws HeadlessException, AWTException {
            return peer.getRGBPixels(screenRect);
    }

    public WritableRaster createRasterScreenCapture(int pixels[]) throws HeadlessException, AWTException {
    //  BufferedImage image;
        DataBufferInt buffer;
        WritableRaster raster;

        pixels = peer.getRGBPixels(screenRect);
        buffer = new DataBufferInt(pixels, pixels.length);

        raster = Raster.createPackedRaster(buffer, screenRect.width, screenRect.height, screenRect.width, bandmasks, null);
    //  SunWritableRaster.makeTrackable(buffer);
        return raster;
    }
}

In essence, all I've changed from the original is moving many of the allocations from function bodies, and set them as attributes of the class so they're not called every time. Doing this actually had a significant affect on frame rate. Even on my severely under powered laptop, it went from ~4 fps with the stock Robot class, to ~30fps with my FastRobot class.

First Test:

When I started outofmemory errors in my main program, I set up this very simple test to keep an eye on the FastRobot. Note: this is the code which produced the heap profile above.

public class TestFBot {
    public static void main(String[] args) {
        try {
            FastRobot fbot = new FastRobot();

            double startTime = System.currentTimeMillis();
            for (int i=0; i < 1000; i++)
                fbot.createArrayScreenCapture();
            System.out.println("Time taken: " + (System.currentTimeMillis() - startTime)/1000.);

        } catch (AWTException e) {
            e.printStackTrace();
        }
    }
}

Examined:

It doesn't do this every time, which is really strange (and frustrating!). In fact, it rarely does it at all with the above code. However, the memory issue becomes easily reproducible if I have multiple for loops back to back.

Test 2

public class TestFBot {
    public static void main(String[] args) {
        try {
            FastRobot fbot = new FastRobot();

            double startTime = System.currentTimeMillis();
            for (int i=0; i < 1000; i++)
                fbot.createArrayScreenCapture();
            System.out.println("Time taken: " + (System.currentTimeMillis() - startTime)/1000.);

            startTime = System.currentTimeMillis();
            for (int i=0; i < 500; i++)
                fbot.createArrayScreenCapture();
            System.out.println("Time taken: " + (System.currentTimeMillis() - startTime)/1000.);

            startTime = System.currentTimeMillis();
            for (int i=0; i < 200; i++)
                fbot.createArrayScreenCapture();
            System.out.println("Time taken: " + (System.currentTimeMillis() - startTime)/1000.);

            startTime = System.currentTimeMillis();
            for (int i=0; i < 1500; i++)
                fbot.createArrayScreenCapture();
            System.out.println("Time taken: " + (System.currentTimeMillis() - startTime)/1000.);

        } catch (AWTException e) {
            e.printStackTrace();
        }
    }
}

Examined

The out of control heap is now reproducible I'd say about 80% of the time. I've looked all though the profiler, and the thing of most note (I think) is that the garbage collector seemingly stops right as the fourth and final loop begins.

The output form the above code gave the following times:

Time taken: 24.282    //Loop1
Time taken: 11.294    //Loop2
Time taken: 7.1       //Loop3
Time taken: 70.739    //Loop4

Now, if you sum the first three loops, it adds up to 42.676, which suspiciously corresponds to the exact time that the garbage collector stops, and the memory spikes.

enter image description here

Now, this is my first rodeo with profiling, not to mention the first time I've ever even thought about garbage collection -- it was always something that just kind of worked magically in the background -- so, I'm unsure what, if anything, I've found out.

Additional Profile Information

enter image description here

Augusto suggested looking at the memory profile. There are 1500+ int[] that are listed as "unreachable, but not yet collected." These are surely the int[] arrays that the peer.getRGBPixels() creates, but for some reason they're not being destroyed. This additional info, unfortunately, only adds to my confusion, as I'm not sure why the GC wouldn't be collecting them


Profile using small heap argument -Xmx256m:

At irreputable and Hot Licks suggestion I set the max heap size to something significantly smaller. While this does prevent it from making the 1gb jump in memory usage, it still doesn't explain why the program is ballooning to its max heap size upon entering the 4th iteration.

enter image description here

As you can see, the exact issue still exists, it's just been made smaller. ;) The issue with this solution is that the program, for some reason, is still eating through all of the memory it can -- there is also a marked change in fps performance from the first the iterations, which consume very little memory, and the final iteration, which consumes as much memory as it can.

The question remains why is it ballooning at all?


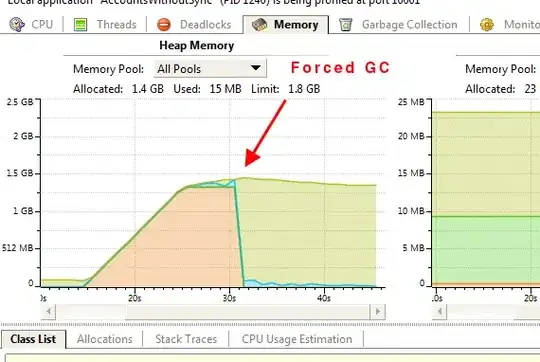
Results after hitting "Force Garbage Collection" button:

At jtahlborn's suggestion, I hit the Force Garbage Collection button. It worked beautifully. It goes from 1gb of memory usage, down to the baseline of 60mb or so.

enter image description here

So, this seems to be the cure. The question now is, how do I programmatically force the GC to do this?


Results after adding local Peer to function's scope:

At David Waters suggestion, I modified the createArrayCapture() function so that it holds a local Peer object.

Unfortunately no change in the memory usage pattern.

enter image description here

Still gets huge on the 3rd or 4th iteration.


Memory Pool Analysis:

ScreenShots from the different memory pools

All pools:

All pools

Eden Pool:

Eden Pool

Old Gen:

Old Gen
Just about all of the memory usage seems to fall in this pool.

Note: PS Survivor Space had (apparently) 0 usage


I'm left with several questions:

(a) does the Garbage Profiler graph mean what I think it means? Or am I confusing correlation with causation? As I said, I'm in an unknown area with these issues.

(b) If it is the garbage collector... what do I do about it..? Why is it stopping altogether, and then running at a reduced rate for the remainder of the program?

(c) How do I fix this?

What's going on here?

Cœur
  • 37,241
  • 25
  • 195
  • 267
Zack Yoshyaro
  • 2,056
  • 6
  • 24
  • 46
  • 3
    You're using yourkit, why don't you profile the memory and see what objects you're creating, and how big they are. It looks like you're creating some images in memory, which you might not be removing from memory (from where do you call `createRasterScreenCapture()`)? – Augusto Feb 28 '13 at 16:50
  • @Augusto I've edited my post with additional profile information. 1500 `int[]`s are uncollected by the GC, and listed as "unreachable." I'm not sure I follow your last question.. all of the `createArraycap..` calls are being done from the same `FastRobot` object. Is that what you mean? – Zack Yoshyaro Feb 28 '13 at 17:13
  • First, we need to make is absolutely clear that rising "storage usage", up to the point of the heap size limit, is not a problem. The GC does not kick in until the available heap space is nearly exhausted, and once storage has been "colonized" by the heap it will remain allocated for the duration of the JVM run. – Hot Licks Feb 28 '13 at 17:16
  • try a smaller max memory. – irreputable Feb 28 '13 at 17:19
  • 1
    Second, "leaks" in Java (outside of code that uses JNI) are almost always (99.999% of the time) due to a coding error where the programmer "hangs on to" old data (though often unintentionally). It's a good practice to always clear pointers (ahem, "object references") in objects that reference other large objects when those large objects will no longer be used. Eg, if you have a 10K element array you used for something, and you're done with that array, clear all the pointers to it that may be in other objects. – Hot Licks Feb 28 '13 at 17:19
  • @irreputable I've edited to show the results of a small heap size. It obviously prevents the 1gb jump, but it still makes a huge jump to the max allowed. So the issue remain of not knowing *why* it makes the jump, and *only* on the final iteration. – Zack Yoshyaro Feb 28 '13 at 17:35
  • GC is kind of a lazy bachelor, he only cleans his room when it's full of garbages. – irreputable Feb 28 '13 at 17:37
  • @HotLicks Given the code above, what do you think would be holding on to references to the arrays? As I understand the code, the arrays should all be getting throws away since they're never assigned to anything. They other brain teaser is *why* would it only keep references to objects on the final iteration? – Zack Yoshyaro Feb 28 '13 at 17:37
  • which memory pool has all these unclaimed objects? – jtahlborn Feb 28 '13 at 17:40
  • @irreputable ha! Fair enough analogy, but who's doing the cleaning for the first 3 loops of the program, his mum? It's memory usage balloons by a factor of 16 after the third loop, but the program itself doesn't do anything differently (hopefully I'm conveying that correctly). – Zack Yoshyaro Feb 28 '13 at 17:40
  • also, if you hit the manual gc button, do these arrays go away? – jtahlborn Feb 28 '13 at 17:41
  • Is it really worth the effort not using Robot.createScreenCapture? How do they compare w.r.t. speed and memory foot print? – Joop Eggen Feb 28 '13 at 17:51
  • @jtahlborn They do! I've edited the post with results so you can see. Re: your other question, I'm not entirely sure how to see which memory pool they sit in. I'll have to look up how to do that really quick. I'll edit the question once I figure out how to get that info. – Zack Yoshyaro Feb 28 '13 at 17:51
  • @JoopEggen I thought I mentioned that in my post, but yep! Definitely worth it. I went from about 4fps on my laptop with stock Robot to a reliable 30fps with my version. – Zack Yoshyaro Feb 28 '13 at 17:53
  • what are the full command line arguments being used? – drone.ah Feb 28 '13 at 17:56
  • note,i'm not necessarily advocating forcing gc as the "solution", just confirming that the data is, in fact, collectable (which it seems to be). you should be able to toggle the "Memory Pool" field at the top of the Memory tab to determine where the memory is sitting. – jtahlborn Feb 28 '13 at 18:03
  • @jtahlborn Posted the memory pools in question. Eden spikes in the 200mb range, while the PS Old Gen pool has the lot of the 1.3gb allocated. Does manually calling the GC cause stability problems? – Zack Yoshyaro Feb 28 '13 at 18:17
  • @drone.ah The only argument I'm sending to the VM is `-Xmx`, which I've used to change the heap size for different run tests. – Zack Yoshyaro Feb 28 '13 at 18:18
  • I'd be interested in how much memory is occupied by the 1500 int[] instances you mention. And how many of them there are after each iteration. And whether calling System.gc() makes any difference in those numbers, if they're high enough to account for most of the problem. – arcy Feb 28 '13 at 18:31
  • Keep in mind that creating even a short-lived object is not "free". The system must spend time both creating and collecting the object, and collecting is often the larger part of the job. If your rate of object creation is high then, once storage "fills up", it's not at all unusual to find that you're spending 50% of your CPU in GC. – Hot Licks Feb 28 '13 at 18:34
  • @ZackYoshyaro, have you tried specifying a garbage collector manually? Concurrent Mark Sweep is a good general purpose one that provides a good balance between low-pause and reasonable throughput. If you are on Java 7 or later Java 6, G1 collector is probably better. – drone.ah Feb 28 '13 at 21:26
  • @drone.ah Holy mother of...! I want to buy you a beer! I set it to Concurrent Mark Sweep and it now behaves like a champ! I have been unable to reproduce the bloated memory problem -- and I've run a *lot* of tests trying to do so. As an added bonus, the performance of the whole app has gone up by near 30%. An fps increase from 30 to 40. I'll need to actually throttle it a bit now. Please submit this as the answer so I can mark it correct! Many, many thanks, man. Two days I've been stressing over this. Finally solved. Big thanks to everyone who helped narrow down the issue! – Zack Yoshyaro Mar 01 '13 at 17:38
  • Something else you might want to consider if this is for production purposes. You have taken the source code for an official Java class and modified it. This mean you have to abide to the license for said source code if you want to actually use it. For OpenJDK classes this is most likely GPL (Oracle has their own license with a lot of fine print) which mean you now have GPL code in your sources. This may be a bad thing for you. – Thorbjørn Ravn Andersen Sep 01 '16 at 08:03

2 Answers2

4

Try specifying a garbage collector manually.

Concurrent Mark Sweep is a good general purpose one that provides a good balance between low-pause and reasonable throughput.

If you are on Java 7 or later Java 6, G1 collector is probably better since it is able to also prevent memory fragmentation.

You can check the Java SE Hotspot Virtual Machine Garbage Collection Tuning page for more information and pointers :-D

drone.ah
  • 1,135
  • 14
  • 28
3

You said you moved object creation from methods to fields on the class. Was one of the dependencies you moved "peer"? e.g.

peer = ((ComponentFactory)toolkit).createRobot(elRoboto, screen);

It could well be that the peer holds on to all screenshots taken for the life of the object, this would get cleared when peer moved out of scope, end of the method in Robot, the life of the class for FastRobot.

Try moving the creation and scope of peer back to your method and see what the difference is.

public int[] createArrayScreenCapture() throws HeadlessException, AWTException {
        RobotPeer localPeer = ((ComponentFactory)toolkit).createRobot(elRoboto, screen);
        return localPeer.getRGBPixels(screenRect);
}

Attempt 2

So, this seems to be the cure. The question now is, how do I pro grammatically force the GC to do this?

You can call System.gc() to request a garbage collection. Note this is a request, not a demand. The JVM will only run the garbage collection if it thinks its worth while.

As you can see, the exact issue still exists, it's just been made smaller. ;) The issue with this solution is that the program, for some reason, is still eating through all of the memory it can -- there is also a marked change in fps performance from the first the iterations, which consume very little memory, and the final iteration, which consumes as much memory as it can.

The question remains why is it ballooning at all?

The JVM will try and only run a Major Garbage Collection when absolutely necessary (most of heap used). ( Read into Young Generation vs Old Generation and within Young Generation, Eden space and survivor space). So expect long lived or memory hungry java applications to sit near the maximum heap size. It is worth noting that for memory to move into the Old Generation it must of survived 3 minor GC runs (Eden => Survivor 1 => Survivor 2 => Old Generation [Depending on what JVM you are running and what GC scheme you have selcted on command line arguments.])

As for why this behaviour changes, it could be any number of things. This last loop is the longest, does System.getCurrentTimeMillis() block for long enough for the GC to have a go on a different thread? So the problem only shows in the longer loops? The process of taking a screen shot sound pretty low level to me, I assume implemented with call to the operatating system kernal, does this block the process in kernal space preventing other threads from running? (which would stop the gc running in background thread).

Have a look at http://www.javacodegeeks.com/2012/01/practical-garbage-collection-part-1.html for an introduction to the world of garbage collection. Or Java Memory explained (SUN JVM) for heaps more links.

Hope that has helped.

Community
  • 1
  • 1
David Waters
  • 11,979
  • 7
  • 41
  • 76
  • I just ran this a couple of times, but unfortunately I still get the same phenomenon. On the third or fourth iteration, the memory usage explodes. I've edited the question if you want to see the profiler output. – Zack Yoshyaro Feb 28 '13 at 18:01