14

I am wondering if it is possible to use the table captions like figure captions using knitr in .Rmd file ?

I saw options for figure caption but I couldn't see the option for the table caption. I also want to remove the message such as "% latex table generated in R 2.15.2 by xtable 1.7-0 package % Wed Mar 06 15:02:11 2013" .

I used X table to create the table: The sample code I used is as follows:

```{r table2, results='asis', message=FALSE} 
library(xtable) 
print(xtable(head(iris))) 
``` 

The table I got after processing through pandoc is as follows:

enter image description here

I tried to use message=FALSE in Rmd file to get rid of the message shown above. I also want to know if it is possible to automatically add the caption for table in Rmd ?

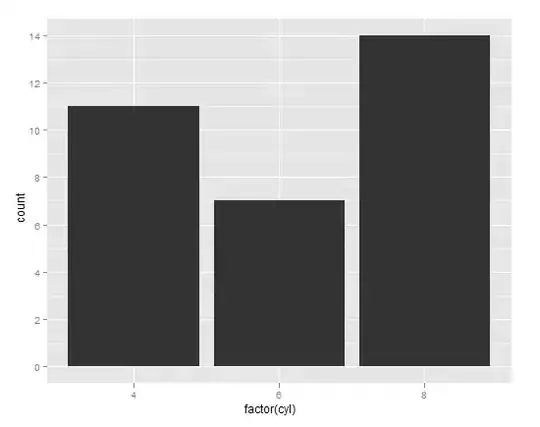
By caption I mean something like below (this is for the figure) and the figure number is automatically updated.

This output is a snapshot from the pdf generated by pdf using the markdown file created by knitr.
enter image description here

Thank you.

Jd Baba
  • 5,948
  • 18
  • 62
  • 96
  • I think that much of the answers you seek are through using `?xtable` and `?print.xtable`. Look at `type` and `caption` – Tyler Rinker Mar 06 '13 at 22:30
  • for the LaTeX comment, the issue has been solved in `xtable`; see https://github.com/yihui/knitr-book/issues/3 (the new version of `xtable` is on CRAN now) – Yihui Xie Mar 06 '13 at 22:41
  • @ Yihui: I upgraded my xtable from CRAN and now I have latest version and I am still getting the same output. I used the code
    ```{r table2, results='asis', message=FALSE,echo=FALSE} 
    library(xtable) 
    print(xtable(head(iris))) 
    ``` 
    . Did I do anything wrong ?
    – Jd Baba Mar 07 '13 at 02:00
  • 1
    @Jdbaba read the documentation `?print.xtable` and see the `comment` argument – Yihui Xie Mar 07 '13 at 16:00
  • @Jdbaba. I guess you have solved now the problem with the xtable showing the "% latex table generated in R 2.15.2 by xtable". I can not find the solution even by looking on print.xtable. Thanks. – Maximilian Aug 28 '13 at 11:29
  • 1
    So, here is the solution: print(xtable(yourtable, comment = getOption("xtable.comment", FALSE)) – Maximilian Aug 28 '13 at 12:22

4 Answers4

12

If you do not insist on using a LaTeX/HTML-only solution with the otherwise awesome xtable package, you might achieve the same with Pandoc's markdown. One option is to add the caption manually below the table, or use my R Pandoc writer package:

> library(pander)                         # load pkg
> panderOptions('table.split.table', Inf) # not to split table
> set.caption('Hello Fisher!')            # add caption
> pander(head(iris))                      # show (almost) any R object in markdown
-------------------------------------------------------------------
 Sepal.Length   Sepal.Width   Petal.Length   Petal.Width   Species 
-------------- ------------- -------------- ------------- ---------
     5.1            3.5           1.4            0.2       setosa  

     4.9            3.0           1.4            0.2       setosa  

     4.7            3.2           1.3            0.2       setosa  

     4.6            3.1           1.5            0.2       setosa  

     5.0            3.6           1.4            0.2       setosa  

     5.4            3.9           1.7            0.4       setosa  
-------------------------------------------------------------------

Table: Hello Fisher!

Then use Pandoc to convert this markdown file to HTML, LaTeX, docx, odt or any other popular document formats.

daroczig
  • 28,004
  • 7
  • 90
  • 124
  • I'm trying to use your nice `pander` package, but couldn't find an option to control the **position** of a table's *caption* (by default, the position is below the table, but I need above). I looked through documentation and on the Web, but to no avail. Any advice? (I understand that I can produce caption independently as R Markdown text, but then there is an issue of margin between the caption and the table. It would be nice to be able to specify both the position (above/below) and the margin.) – Aleksandr Blekh Nov 19 '14 at 08:24
  • 1
    @AleksandrBlekh having the caption above the table is not a valid markdown syntax, it should stay below the table. On the other hand, you can render that to be above the table/image in e.g. HTML or LaTeX. For the prior, use JavaScript, for the latter, I suggest the `caption` and `floatrow` LaTeX packages, like `\floatsetup[table]{capposition=top}` – daroczig Nov 19 '14 at 10:21
  • Thanks for fast reply and nice suggestions! One of the reasons I'm trying to use `pander` and R Markdown format is to be able to produce multi-format output, as needed. Going the format-specific route is not optimal in this regard (no single codebase); I actually implemented some stuff in a LaTeX-specific way and it took a while just for that. Can't imagine spending more time to support HMTL, etc. Actually, I found a solution: I need `pandoc` 1.13+, which contains this fix (caption should be on top): search for "table captions above tables" here: http://johnmacfarlane.net/pandoc/releases.html. – Aleksandr Blekh Nov 19 '14 at 13:16
  • I can't find `pandoc `binary for that release or higher for Ubuntu/Debian anywhere. I think nobody has it yet. I've read on some mailing list that even Yihui can't find it. If you will find it, please let me know. – Aleksandr Blekh Nov 19 '14 at 13:19
  • 1
    @AleksandrBlekh This fix sounds great, but it seems to be LaTeX-only to me. RStudio has released some binaries: https://s3.amazonaws.com/rstudio-buildtools/pandoc-1.13.1.zip Anyway, you can still use markdown with multiple output formats and "captions above tables/images", but this way you have to develop your custom templates for HTML, PDF etc. This is a one-time investment, that you can use for all future reports, so besides the above mentioned one-liner LaTeX call, you'd need also another one-liner JavaScript call in your custom HTML template to move caption above the objects. – daroczig Nov 19 '14 at 14:21
  • I appreciate your comments and link to the binary. I'm not sure I understand the need for developing templates (unless you meant that in context of using older versions of `pandoc` without the fix). If I don't need something fancy, aren't the default ones good enough? Sorry, if my question sounds stupid, but I'm not yet fluent in under-the-hood complexities of reproducible research tools (but willing and doing my best to learn as much as I can). P.S. Why do you think that fix is LaTeX-only? – Aleksandr Blekh Nov 19 '14 at 17:04
  • 1
    @AleksandrBlekh the changelog you linked above has the quote part below the "LaTeX writer" section, so I think this update has nothing to do with the other output formats. Also, I think the markdown specification of captions (to have it below the table) has not changed either. About "templates": probably I should have written "stylesheets" instead, see e.g. `--template` and `-H` at http://johnmacfarlane.net/pandoc/README.html#general-writer-options In short: you can override the bundled design of Pandoc created documents. – daroczig Nov 19 '14 at 20:23
  • Thank you for clarification. Will review the info. – Aleksandr Blekh Nov 20 '14 at 07:46
10

You can insert tables with automatically numbered captions in markdown for processing with pandoc using straight knitr code. Insert this code snippet at the top of your .rmd file:

```{r setup, echo=FALSE}
tn = local({
  i = 0
  function(x) {
    i <<- i + 1
    paste('\n\n:Table ', i, ': ', x, sep = '')
    # The : before Table tells pandoc to wrap your caption in <caption></caption>
  }
})
knit_hooks$set(tab.cap = function(before, options, envir) {
  if(!before)
    tn(options$tab.cap)
})
default_output_hook = knit_hooks$get("output")
knit_hooks$set(output = function(x, options) {
  if (is.null(options$tab.cap) == F)  
    x
  else
    default_output_hook(x,options)
})
```

To insert a numbered table caption:

```{r myirischunk, tab.cap="This is the head of the Iris table"}
kable(head(iris))
```

By overriding the output hook and using tab.cap you don't need to clutter your chunk options with results='asis'.

Thanks Knitr!

PS: If you want to convert to latex/pdf you would probably want latex to number the tables for you. In that case you could change tn(options$tab.cap) to paste('\n\n:', options$tab.cap, sep='') - but I haven't tested this.

DeanK
  • 101
  • 1
  • 3
  • I tried this with RStudio running rmarkdown_0.3.3; I did not need the `:` after `\n\n`. Because the : was printing. However, I cannot figure out how to get the caption BEFORE (ABOVE) the table. How could I revise the hook to make that work? For figures, I can do it with `knit_hooks$set(plot = function(x, options) { paste('
    ', options$fig.cap, '
    ', sep = '')`
    – jessi Nov 07 '14 at 16:43
  • I changed: `paste('\n\n:Table ', i, ': ', x, sep = '') to paste('\n\nTable ', i, ': ', x, sep = '','

    ')` to add space after the caption, remove the : which was printed, and retain the caption formatting
    – Tony Ladson Apr 22 '15 at 01:03
  • @DeanK: any recommendations on how this would look like if I want to add a short version of the caption to the TOC, i.e. `tab.scap`? See also https://github.com/yihui/knitr/issues/1679 – mavericks May 31 '20 at 12:26
5

You can accomplish this with xtable. Add caption to xtable and comment=FALSE to the print function.

print(
  xtable(
    head(iris),
    caption = 'Iris data'
  ),
  comment = FALSE,
  type = 'latex'
)

See the xtable and print.xtable documentation.

junkka
  • 543
  • 7
  • 11
0

I know this is since many years ago, but if there is someone like me who arrived here looking for an answer I'll tell you the answer that I found to the same problem.

It was really simply, we just need to put:

```{r mostrarSerie,results='asis',echo=FALSE}
library(xtable)
options(xtable.floating = TRUE)
print(xtable(AP, digits = 0,caption = "Serie de tiempo"),comment = FALSE)
```

The important step is to put into the options xtable.floating = TRUE because so LaTeX will recognize the table.