How would I go about implementing a spectrum analyser like the ones in WinAmp below?
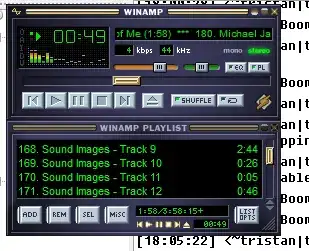
Just by looking at it, I think that these bars are rendered to display the 'volume level' of a specific frequency band of the incoming audio data; however, I'm not sure how to actually calculate this data needed for the rather easy task of drawing the bars.
From what I've been told and understand, calculating these values can be done by using an FFT — however, I'm not exactly sure how to calculate those, given a buffer of input data — am I on the right track about FFTs? How would I apply an FFT on the input data and get, say, an integer out of the FFT that represents the 'volume' of a specific frequency band?
The drawing part isn't a problem, since I can just draw directly to my framebuffer and render that out. I'm doing this as a project on an FPGA, using a Nios II soft-CPU, in case anyone's wondering about potential hardware limitations. Audio data comes in as 24-bit data at 96kHz.