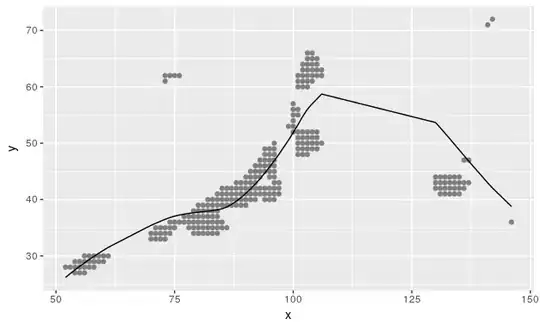
I have a data set with some points in it and want to fit a line on it. I tried it with the loess function. Unfortunately I get very strange results. See the plot bellow. I expect a line that goes more through the points and over the whole plot. How can I achieve that?

How to reproduce it:
Download the dataset from https://www.dropbox.com/s/ud32tbptyvjsnp4/data.R?dl=1 (only two kb) and use this code:
load(url('https://www.dropbox.com/s/ud32tbptyvjsnp4/data.R?dl=1'))
lw1 = loess(y ~ x,data=data)
plot(y ~ x, data=data,pch=19,cex=0.1)
lines(data$y,lw1$fitted,col="blue",lwd=3)
Any help is greatly appreciated. Thanks!