11

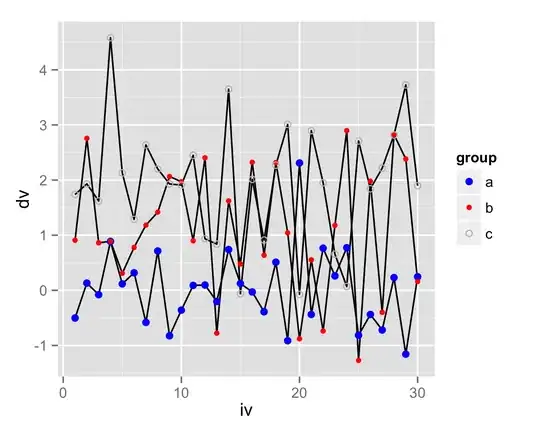
I am new to ggplot2. I would like to create a line plot that has points on them where the points are filled with different colors than the lines (see the plot below). enter image description here Suppose the dataset I am working with is the one below:
set.seed(100)
data<-data.frame(dv=c(rnorm(30), rnorm(30, mean=1), rnorm(30, mean=2)), 
                 iv=rep(1:30, 3), 
                 group=rep(letters[1:3], each=30))

I tried the following code:

p<-ggplot(data, aes(x=iv, y=dv, group=group,  pch=group)) + geom_line() + geom_point()

p + scale_color_manual(values=rep("black",3))+ scale_shape(c(19,20,21)) + 
scale_fill_manual(values=c("blue", "red","gray"))

p +  scale_shape(c(19,20,21)) + scale_fill_manual(values=c("blue", "red","gray"))

But I do not get what I want.I hope someone can point me to the right direction. Thanks!
Alex
  • 4,030
  • 8
  • 40
  • 62

1 Answers1

21

scale_fill_manual(), scale_shape_manual() and scale_colour_manual() can be used only if you have set fill=, shape= or colour= inside the aes().

To change colour just for the points you should add colour=group inside geom_point() call.

  ggplot(data, aes(x=iv, y=dv, group=group,shape=group)) + 
    geom_line() + geom_point(aes(colour=group)) +
    scale_shape_manual(values=c(19,20,21))+
    scale_colour_manual(values=c("blue", "red","gray"))

enter image description here

Didzis Elferts
  • 95,661
  • 14
  • 264
  • 201
  • 2
    What if the plot has already been created and I want change the color palette of that? – qed Mar 09 '15 at 15:32
  • How to fill the group c circle with grey color without changing the shape value? – Robin May 23 '23 at 09:20