1

How to create TimeSeriesChart with constant distance for domain Axis (X values), just like LineChart but with DateAxis?

Normal TimeSeriesChart looks like this:

enter image description here

But I need something like:

enter image description here

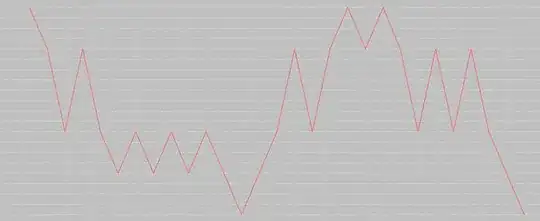
with Date Axis on the bottom

Chart data are changing very frequently, and when I'm using simple LineChart domain axis is unreadable...

I've created some class extending XYSeries which sets next values to X and I've changed number formatter to render specific date, but this solution is just bad workaround

GrahamA
  • 5,875
  • 29
  • 39
jmichal
  • 11
  • 1

2 Answers2

1

Rather than extending XYSeries try setting XYSeries#setMaximumItemCount(int) to the maximum number of items that you want to show in you chart this will stop the chart becoming unreadable.

In your second screen it looks like you are using a constant x interval, if you time are constant you will get a chart like this, if not use an integer axis otherwise you will get irregular steps.

GrahamA
  • 5,875
  • 29
  • 39
  • I have to display so much data, and I set XSeries#setMaximumItemCount(int) to 100, I'm sorry but this is not solution. The problem is that data don't have constat interval, and I can't change it. – jmichal Mar 27 '13 at 21:20
1

If you have significant gaps in the domain, you could try a CombinedRangeXYPlot with a subplot for each contiguous time interval.

Addendum: Also, consider either or both of these settings for pan & zoom, illustrated here.

plot.setDomainPannable(true);
chartPanel.setMouseWheelEnabled(true);
Community
  • 1
  • 1
trashgod
  • 203,806
  • 29
  • 246
  • 1,045
  • But sill I will not have constant distance in the domain, using CombinedRangeXYPlot I will just remove bigger gaps – jmichal Mar 28 '13 at 07:24