A polygon is represented by two lists. List xs contains x coordinates in decreasing order. For each x value, the corresponding element in list regions is a list of slices. Each slice indicates a y range that belongs to the interior of a polygon. For each x value, the slices are sorted in increasing order.
I want to draw the filled polygon using Matplotlib's fill function. That function needs the points to be ordered so that going from point to point describes the contour of the polygon. How can I order the points in my data set to obtain the right polygon?
Here is an example of the kind of data I have.
xs = range(10, 0, -1)
regions = [[slice(0, 3)],
           [slice(0, 4), slice(5.2, 5.8)],
           [slice(1, 5), slice(5.4, 5.8)],
           [slice(1.3, 6)],
           [slice(1.8, 6)],
           [slice(1.9, 3), slice(3.1, 6.1)],
           [slice(2, 2.9), slice(3.2, 5), slice(6, 6.2)],
           [slice(2.1, 2.7), slice(3.4, 5.1), slice(5.9, 6.3)],
           [slice(3.5, 5.2), slice(5.7, 6.4)],
           [slice(3.8, 5.3), slice(5.8, 6.1)]]
The correct way to order the points is as follows
xx = [10, 9, 8, 7, 6, 5, 4, 3, 3, 4, 5, 5, 4, 3, 2, 1,
   1, 2, 3, 4, 4, 3, 2, 1, 1, 2, 3, 4, 5, 6, 7, 8,
   9, 9, 8, 8, 9, 10]
yy = [0, 0, 1, 1.3, 1.8, 1.9, 2, 2.1, 2.7, 2.9, 3, 3.1,
      3.2, 3.4, 3.5, 3.8, 5.3, 5.2, 5.1, 5, 6, 5.9, 5.7,
      5.8, 6.1, 6.4, 6.3, 6.2, 6.3, 6, 6, 5.8, 5.8, 5.2,
      5.4, 5, 4, 3]
and the figure should look as such
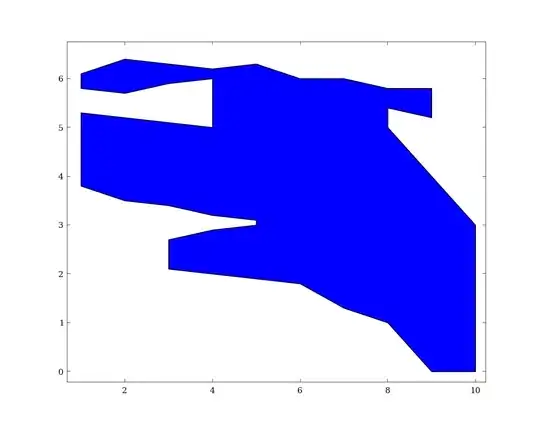
So far, I have tried defining turning points, i.e., x values where the contour changes direction. This can be done with numpy.diff applied to an array containing the number of slices for each x value. If the difference is not zero, that x value is a turning point. This can probably be used to figure out the next point. The difficulty is to figure out which slice is next and whether to use the start or the end of the slice.
This question is similar, but in my case the polygons have a much more complicated shape. On the other hand, I do have information about what is inside the polygon.
Edit
I just realized that the problem as stated does not always have a unique solution. For instance, the set of points in the example above also admits the solution
xx = [10, 9, 8, 7, 6, 5, 4, 3, 2, 1, 1, 2, 3, 4, 5, 5,
       4, 3, 3, 4, 4, 3, 2, 1, 1, 2, 3, 4, 5, 6, 7, 8,
       9, 9, 8, 8, 9, 10]
yy = [0, 0, 1, 1.3, 1.8, 1.9, 2, 2.1, 3.5, 3.8, 5.3, 5.2,
      2.7, 2.9, 3, 3.1, 3.2, 3.4, 5.1, 5, 6, 5.9, 5.7,
      5.8, 6.1, 6.4, 6.3, 6.2, 6.1, 6, 6, 5.8, 5.8, 5.2,
      5.4, 5, 4, 3]
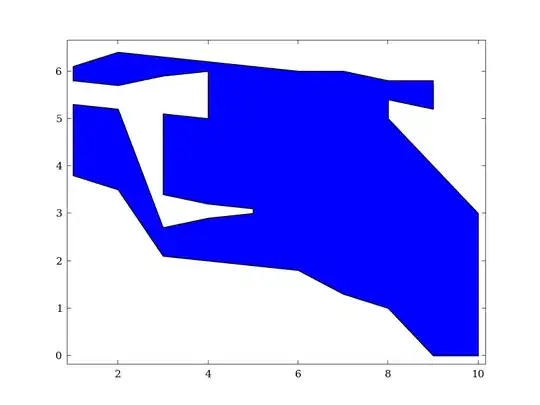
The solution I am looking for is the one that minimizes the absolute value of each edge's slope (apart from the vertical segments). In the example above, this corresponds to the first solution.