3

I have computed monthly returns from a price series. I then build a dataframe as follows:

    y.ret_1981    y.ret_1982    y.ret_1983   y.ret_1984   y.ret_1985
1   0.0001015229  0.0030780203 -0.0052233836  0.017128325 -0.002427308
2   0.0005678989  0.0009249838 -0.0023294622 -0.030531971  0.001831160
3  -0.0019040392 -0.0021614791  0.0022451252 -0.003345983  0.005773503
4  -0.0006015118  0.0010695681  0.0052680258  0.008592513  0.009867972
5   0.0052736054 -0.0003181347 -0.0008505673 -0.000623061 -0.012225140
6   0.0014266119 -0.0101045071 -0.0003073150 -0.016084505 -0.005883687
7  -0.0069002733 -0.0078170620  0.0070058676 -0.007870294 -0.010265335
8  -0.0041963258  0.0039905142  0.0134996961 -0.002149331 -0.007860940
9   0.0020778541 -0.0038834826  0.0052289589  0.007271409 -0.005320848
10  0.0030956487 -0.0005027686 -0.0021452210  0.002502301 -0.001890657
11 -0.0032375542  0.0063916686  0.0009331531  0.004679741  0.004338580
12  0.0014882164  0.0039578527  0.0136663415  0.000000000  0.003807668

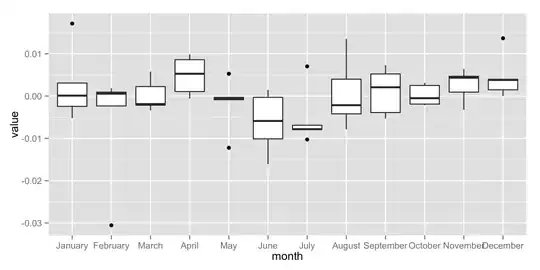
... where columns are the monthly returns for the years 1981 to 1985 and the rows 1 to 12 are the months of the year.

I would like to plot a a boxplot similar to the one below:

boxplot

So what can I go? And I would like my graph to read the months of the years instead of integer 1 to 12.

Thank you.

tagoma
  • 3,896
  • 4
  • 38
  • 57

1 Answers1

5

First, add new column month to your original data frame containing month.name (built-in constant in R) and use it as factor. It is import to set also levels= inside the factor() to ensure that months are arranged in chronological order not the alphabetical.

Then melt this data frame from wide format to long format. In ggplot() use month as x values and value as y.

df$month<-factor(month.name,levels=month.name)
library(reshape2)
df.long<-melt(df,id.vars="month")
ggplot(df.long,aes(month,value))+geom_boxplot()

enter image description here

Didzis Elferts
  • 95,661
  • 14
  • 264
  • 201
  • thank you for your reply. i don't understand well how you use value in ggplot(df.long,aes(month,value))+geom_boxplot() . did your rename the columns ? – tagoma Apr 14 '13 at 12:19
  • Function melt() automatically puts all values in column value. You can change it using argument value.name= inside melt(). – Didzis Elferts Apr 14 '13 at 12:21
  • ah! my problem was i didn't use the right data argument with melt(). i used month.abb instead of month.name . thank you very much, indeed. i know almost nothing about the reshape2 package. :) – tagoma Apr 14 '13 at 12:26