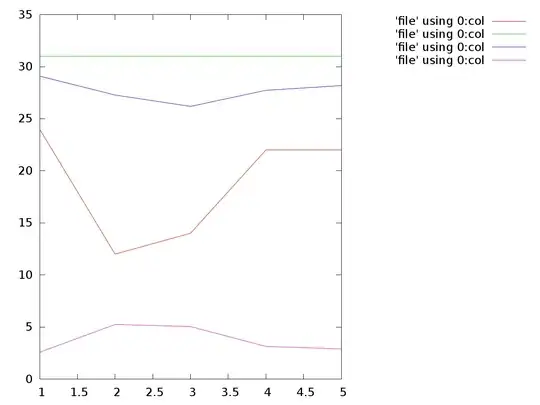
I have a file that contains 4 numbers (min, max, mean, standard derivation) and I would like to plot it with gnuplot.
Sample:
24 31 29.0909 2.57451
12 31 27.2727 5.24129
14 31 26.1818 5.04197
22 31 27.7273 3.13603
22 31 28.1818 2.88627
If I have 4 files with one column, then I can do:
gnuplot "file1.txt" with lines, "file2.txt" with lines, "file3.txt" with lines, "file4.txt" with lines
And it will plot 4 curves. I do not care about the x-axis, it should just be a constant increment.
How could I please plot? I can't seem to find a way to have 4 curves with 1 file with 4 columns, just having a constantly incrementing x value.
Thank you.