I have a data frame like this:
df <- data.frame(
    Dim1 = c("A","A","A","A","A","A","B","B"),
    Dim2 = c(100,100,100,100,200,200,100,200),
    Value = sample(1:10, 8)
        )

  Dim1 Dim2 Value
1    A  100     3
2    A  100     6
3    A  100     7
4    A  100     4
5    A  200     8
6    A  200     9
7    B  100     2
8    B  200    10
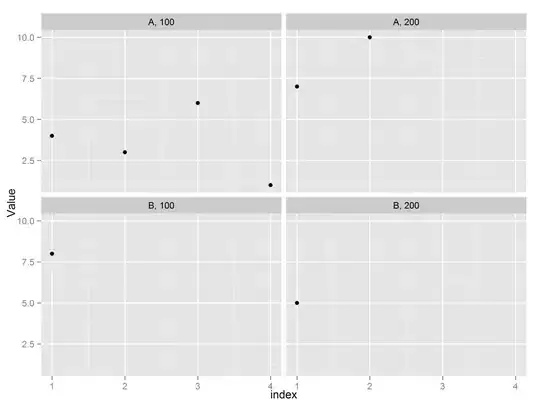
(The Value column is just to illustrate that each row is a data point; the actual value doesn't matter.) Ultimately what I would like to do is plot the values against their index within the subset defined by Dim1 and Dim2. For this reason, I think need to append a new column containing the indices, which would look like this (added blank lines between rows to make it obvious what the subsets are):
  Dim1 Dim2 Value Index
1    A  100     1     1
2    A  100     9     2
3    A  100     4     3
4    A  100    10     4

5    A  200     7     1
6    A  200     3     2

7    B  100     5     1

8    B  200     8     1
How do I do this elegantly in R? I'm coming from Python and my default approach is to for-loop over the combinations of Dim1 & Dim2, keeping track of the number of rows in each and assigning the maximum encountered so far to each row. I've been trying to figure it out but my vector-fu is weak.