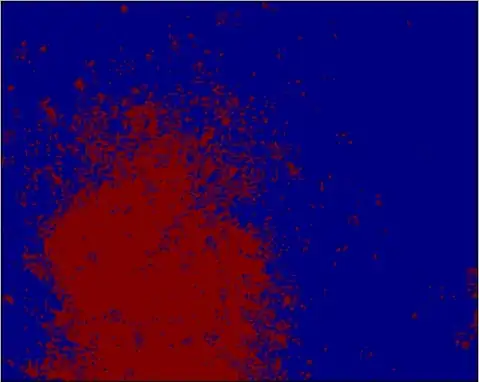
Is there any good algorithm for detecting particles on a changing background intensity? For example, if I have the following image:

Is there a way to count the small white particles, even with the clearly different background that appears towards the lower left?
To be a little more clear, I would like to label the image and count the particles with an algorithm that finds these particles to be significant:
I have tried many things with the PIL, cv , scipy , numpy , etc. modules.
I got some hints from this very similar SO question, and it appears at first glance that you could take a simple threshold like so:
im = mahotas.imread('particles.jpg')
T = mahotas.thresholding.otsu(im)

labeled, nr_objects = ndimage.label(im>T)
print nr_objects
pylab.imshow(labeled)
but because of the changing background you get this:
I have also tried other ideas, such as a technique I found for measuring paws, which I implemented in this way:
import numpy as np
import scipy
import pylab
import pymorph
import mahotas
from scipy import ndimage
import cv


def detect_peaks(image):
    """
    Takes an image and detect the peaks usingthe local maximum filter.
    Returns a boolean mask of the peaks (i.e. 1 when
    the pixel's value is the neighborhood maximum, 0 otherwise)
    """

    # define an 8-connected neighborhood
    neighborhood = ndimage.morphology.generate_binary_structure(2,2)

    #apply the local maximum filter; all pixel of maximal value
    #in their neighborhood are set to 1
    local_max = ndimage.filters.maximum_filter(image, footprint=neighborhood)==image
    #local_max is a mask that contains the peaks we are
    #looking for, but also the background.
    #In order to isolate the peaks we must remove the background from the mask.

    #we create the mask of the background
    background = (image==0)

    #a little technicality: we must erode the background in order to
    #successfully subtract it form local_max, otherwise a line will
    #appear along the background border (artifact of the local maximum filter)
    eroded_background = ndimage.morphology.binary_erosion(background, structure=neighborhood, border_value=1)

    #we obtain the final mask, containing only peaks,
    #by removing the background from the local_max mask
    detected_peaks = local_max - eroded_background

    return detected_peaks

im = mahotas.imread('particles.jpg')
imf = ndimage.gaussian_filter(im, 3)
#rmax = pymorph.regmax(imf)
detected_peaks = detect_peaks(imf)
pylab.imshow(pymorph.overlay(im, detected_peaks))
pylab.show()
but this gives no luck either, showing this result:

Using the regional max function, I get images which almost appear to be giving correct particle identification, but there are either too many, or too few particles in the wrong spots depending on my gaussian filtering (images have gaussian filter of 2,3, & 4):


Also, it would need to work on images similar to this as well:

This is the same type of image above, just at a much higher density of particles.
EDIT: Solved solution: I was able to get a decent working solution to this problem using the following code:
import cv2
import pylab
from scipy import ndimage

im = cv2.imread('particles.jpg')
pylab.figure(0)
pylab.imshow(im)

gray = cv2.cvtColor(im, cv2.COLOR_BGR2GRAY)
gray = cv2.GaussianBlur(gray, (5,5), 0)
maxValue = 255
adaptiveMethod = cv2.ADAPTIVE_THRESH_GAUSSIAN_C#cv2.ADAPTIVE_THRESH_MEAN_C #cv2.ADAPTIVE_THRESH_GAUSSIAN_C
thresholdType = cv2.THRESH_BINARY#cv2.THRESH_BINARY #cv2.THRESH_BINARY_INV
blockSize = 5 #odd number like 3,5,7,9,11
C = -3 # constant to be subtracted
im_thresholded = cv2.adaptiveThreshold(gray, maxValue, adaptiveMethod, thresholdType, blockSize, C)
labelarray, particle_count = ndimage.measurements.label(im_thresholded)
print particle_count
pylab.figure(1)
pylab.imshow(im_thresholded)
pylab.show()
This will show the images like this:
(which is the given image)
and

(which is the counted particles)
and calculate the particle count as 60.