0

I'm normally an R user (a beginning R user, but I'm starting to get the hang of it). However, I have heard positive things about ELKI--in particular, its speed. I came across this old post "How to group nearby latitude and longitude locations stored in SQL" and the answer posted by Anony-Mousse is similar to what I'd like to do. I would like to be able to replicate each step he has done up to the KML file he has shared on Google Drive.

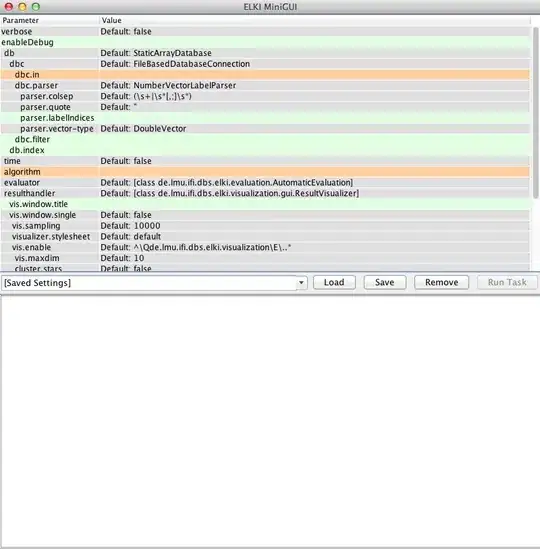
I've downloaded ELKI and am able to run the mini-GUI, which looks like the following:

enter image description here

Could someone post some steps on how to do what Anony-Mousse was able to do?

My data is very similar in nature. I have geocoded addresses in a csv file (more specifically, each tuple is an event and one of the variables/features/columns is the geocoded address of the event) and I'm looking to find clusters much like the OP in the link above.

Hopefully, Anony-Mousse will read this post and come to the rescue. But, I'd be grateful if anyone else could help get me on my way.

Community
  • 1
  • 1
whistler
  • 876
  • 2
  • 15
  • 31
  • Also, I'm interested to know if the visualizations (i.e. red clusters shown on the map) were generated by ELKI or if Anony-Mousse used some other tool? If the latter, which tool did he use to draw the clusters? – whistler Apr 23 '13 at 07:34
  • Well, you should at least show some effort beyond showing an empty screenshot of the UI. At least try to configure an algorithm and input source. – Has QUIT--Anony-Mousse Apr 23 '13 at 12:03
  • simple postprocessing by computing the convex hull of the clusters, then writing it to a KML file for Google Earth. I don't remember whether I did it in a custom `ResultHandler` in ELKI, or whether I just read the resulting clusters into a file and used python. Probably the first. I've recently started to find that easier. – Has QUIT--Anony-Mousse Apr 23 '13 at 12:05
  • Hi Anony-Mousse! The documentation for ELKI online was sparse, so basically I tried setting the dbc.in to my file, setting the algorithm to clustering.OpticsXi (and setting the necessary parameters from the GUI), then I got an error ("Invalid quoted line in input). I have a CSV file with a bunch of columns for each tuple (only one column is the geocoded address). What format was the file in when you answered the previous question? Did you just have the geocoded addresses or other info in the file as well? – whistler Apr 23 '13 at 16:16
  • @Anony-Mousse, should the only two columns in the csv file be latitude and longitude? Also, what is the difference between the geo.LatLngDistanceFunction and geo.LngLatDistanceFunction parameters? Any pointers to get me up and running with this spatial data would be much appreciated. – whistler Apr 23 '13 at 23:42
  • The difference of the two is the order of the latitude and longitude columns. I used a file that had the format "latitude longitude label" and the `geo.LatLngDistanceFunction` as distance function. Yes, ELKI documentation is a bit sparse - we need to *contribute* more. – Has QUIT--Anony-Mousse Apr 24 '13 at 09:00

1 Answers1

1

Sorry about not following up earlier.

I did not keep the code for my experiments you refer to. So I don't remember whether I used a python script to rewrite the output to KML (I believe I did so), or whether I just copy&pasted from the ELKI source to a custom ResultHandler to generate the file. Probably the first, because writing XML in Java is a bit more complicated (although also more likely to be correct XML then) than just printing the document in Python. If so, I probably used the scipy.spatial package for computing the convex hull, reading the ELKI text output is fairly trivial (just skip comment lines, and take the two numeric columns of the other as coordinates)

Has QUIT--Anony-Mousse
  • 76,138
  • 12
  • 138
  • 194