I want to classify a data set (which has four classes) using the SVM method. I've done it using the coding below (using a 1 against all). It isn't terribly accurate but I'm thankful for anything at this stage.
http://www.mathworks.co.uk/matlabcentral/fileexchange/39352-multi-class-svm
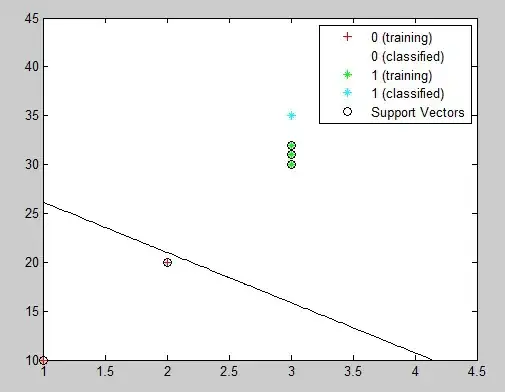
I was wondering if there is a way to plot the support vectors and training points. I've managed this for a 2 class SVM classification but can't find a way of doing it with >2 classes.
Any help/advice re. how to achieve a semi-pretty graph would be very much appreciated!