I'm overplotting multicolored lines on an image, the color of the lines is supposed to represent a given parameter that varies between roughtly -1 and 3.
The following portion of code is the one that builds these lines :
            x = self._tprun.r[0,p,::100]  # x coordinate
            y = self._tprun.r[1,p,::100]  # y coordinate

            points = np.array([x, y]).T.reshape(-1, 1, 2)
            segments = np.concatenate([points[:-1], points[1:]], axis=1)

            # 'color' is the parameter that will color the line

            vmin =  self._color[p,:].min()
            vmax =  self._color[p,:].max()

            lc = LineCollection(segments,
                                cmap=plt.get_cmap('jet'),
                                norm=plt.Normalize(vmin=vmin,vmax=vmax))

            lc.set_array(self._color[p,:])

            lc.set_linewidth(1)
            self._ax.add_collection(lc)
This code is inside a loop on 'p' and so it will create several lines at locations given by the arrays 'x' and 'y' and for which the color should be given by the value of 'self._color[p,:]'.
As I said, '_color[p,:]' roughly varies between -1 and 3. Here is an example of what '_color[p,:]' may be :
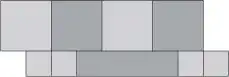
My problem is that the lines that are created appear without much variation of the color, they all look kind of monochrome dark blue whereas _color[p,:] varies much and I ask for the normalization to take its min/max values.
here is an example of such a line (look at the oscillating dark blue line, other black lines are a contour of another value) :
Is there something I'm missing in the way these functions work?