I was wondering, is there a way to set the scale of the plot axis to logarithmic in MuPAD? This is possible with Matlab plots, but I couldn't find an option for MuPAD.
Asked
Active
Viewed 1,405 times
1 Answers
3
CoordinateType attribute allows us to switch between linear and logarithmic plots.
By default CoordinateType is set to LinLin i.e. linear plots. There are 3 cases of logarithmic 2d plots.
Semilog Plots
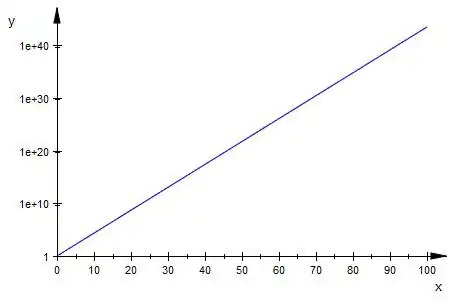
- LinLog - Linear coordinates are plotted along the horizontal axis, logarithmic coordinates along the vertical axis. Functions of form y = exp(c1*x+c2) become straight lines.
E.g. plot(plot::Function2d(exp(x), x = 0 .. 100), CoordinateType = LinLog):
- LogLin - Logarithmic coordinates are plotted along the horizontal axis, linear coordinates along the vertical axis. Functions of form y = c1 ln(x) + c2 become straight lines.
E.g.
plot(plot::Function2d(5*log(10,x) + 8, x = 1 .. 100),CoordinateType = LogLin):

Logarithmic Plots
- LogLog - Logarithmic coordinates are plotted along both axes. E.g.
plot(plot::Function2d(sqrt(5*x) + x^4, x = 10^(-3) .. 10^3), CoordinateType = LogLog):
Reference:Coordinate Type
Community
- 1
- 1
Colorless Photon
- 399
- 1
- 3
- 19