53

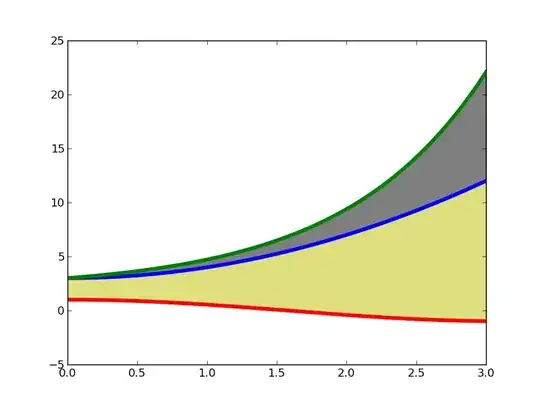
I would like to fill between 3 lines in matplotlib.pyplot but unfortunately the fill_between gives me opportunity to fill between only two lines. Any ideas how to deal with this?

Edit:

Ok, I did not explain what I really mean since I cannot add the picture with my current reputation so maybe in that way:

I try to fill the polygon bounded by these lines and I have no idea how because fill_between gives me opportunity to fill only area between two of them. Below the fill equation:

y <= 4- 2x
y <= 3 - 1/2x
y <= 1 - x
y >= 0
x >= 0

the x and y bigger than 0 is obvious. I start the plot from (0,0) but I still have 3 lines...

y <= 4- 2x
y <= 3 - 1/2x
y <= 1 - x
Cœur
  • 37,241
  • 25
  • 195
  • 267
PaulWebbster
  • 1,480
  • 2
  • 14
  • 27

3 Answers3

60

If you start the plot in point (0, 0), and therefore do not need to consider the area of the polygon not in the first quadrant, then this should do the trick in this particular situation:

import matplotlib.pyplot as plt
import numpy as np

x = np.arange(0,10,0.1)

# The lines to plot
y1 = 4 - 2*x
y2 = 3 - 0.5*x
y3 = 1 -x

# The upper edge of polygon (min of lines y1 & y2)
y4 = np.minimum(y1, y2)

# Set y-limit, making neg y-values not show in plot
plt.ylim(0, 5)

# Plotting of lines
plt.plot(x, y1,
         x, y2,
         x, y3)

# Filling between line y3 and line y4
plt.fill_between(x, y3, y4, color='grey', alpha='0.5')
plt.show()

enter image description here

sodd
  • 12,482
  • 3
  • 54
  • 62
  • Is it possible to add a little node (circle) to one of the intersections in order to distinguish it from other intersections, say in the intersection of blue and green? Is it possible to also show the coordinates of that point? – Drimades Boy Dec 22 '19 at 16:32
39

To use fill_between, specify the X values first, than the two Y sets that you want to "fill between". An example is show below:

import pylab as plt
import numpy as np

X  = np.linspace(0,3,200)
Y1 = X**2 + 3
Y2 = np.exp(X) + 2
Y3 = np.cos(X)

plt.plot(X,Y1,lw=4)
plt.plot(X,Y2,lw=4)
plt.plot(X,Y3,lw=4)

plt.fill_between(X, Y1,Y2,color='k',alpha=.5)
plt.fill_between(X, Y1,Y3,color='y',alpha=.5)

plt.show()

enter image description here

If, instead, you only wanted to fill between Y2 and Y3:

plt.fill_between(X, Y2,Y3,color='m',alpha=.5)

this would give you

enter image description here

Hooked
  • 84,485
  • 43
  • 192
  • 261
14

Just compute the corner points of the polygon, i.e., the points where the lines intersect. Then plot the polygon using pyplot.fill.

Example:

import matplotlib.pyplot as plt

# define corner points
x = [1,2,1,0]
y = [2,1,0,1]

# plot
plt.fill(x,y)
plt.show()

resulting Image: Figure 1

moooeeeep
  • 31,622
  • 22
  • 98
  • 187