17

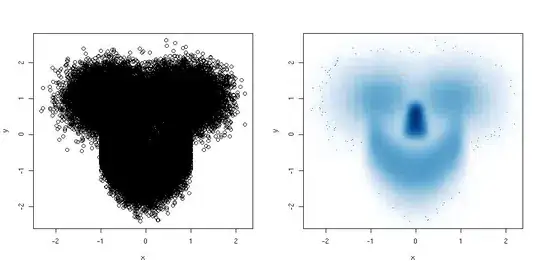
How can I smooth this picture in R, so that only two peaks remain?

If this would be 1d data, I would do a running mean or fit a regression function to it. But I did not find very specific information about applying these methods on a 2d matrix. For example I tried to use filter() from the stats package.

I also thought about kriging, but this is more about interpolation, is it?

spectrogram

m0sa
  • 10,712
  • 4
  • 44
  • 91
nnn
  • 4,985
  • 4
  • 24
  • 34
  • imageJ is good at those things – baptiste Jun 10 '13 at 11:04
  • You might to take a look at the `raster` package. – Paul Hiemstra Jun 10 '13 at 11:11
  • In addition, your question does not show a lot of research effort. You show us what you have tried, and you point to what you do not understand. Right now you are asking us to do the work for you, at least that is how it feels. – Paul Hiemstra Jun 10 '13 at 11:12
  • Thanks for the hint with the `raster` package. I wish I have found this two month ago, because it holds some functions I could have used back then. But I found nothing to solve my present problem. – nnn Jun 12 '13 at 09:13
  • search for image convolution or kernels: https://en.wikipedia.org/wiki/Kernel_(image_processing) – Brian D Dec 04 '18 at 20:18

3 Answers3

21

The package spatstat holds a function blur() that applicates a gaussian blur. This smothes the picture in a way, that most of the noise disappears and the two main peaks are clearly distinctable.

The effect can be seen in the following picture and is quite remarkable, especially in the 3d plot.
effects of blurring

The code to generate the picture was:

library(jpeg)
library(fields)
library(spatstat)

picture <- readJPEG("~/Downloads/spectrogram.png.jpeg")
picture2 <- as.matrix(blur(as.im(picture), sigma=6))

layout(matrix(c(1:4), nrow=2))
image.plot(picture, col=gray.colors(50), main="original image", asp=1)
image.plot(picture2, col=gray.colors(50), main="blurred with sigma = 6", asp=1)
drape.plot(1:nrow(picture), 1:ncol(picture), picture, border=NA, theta=0, phi=45, main="original spectrogram")
drape.plot(1:nrow(picture), 1:ncol(picture), picture2, border=NA, theta=0, phi=45, main="blurred with sigma = 6")
nnn
  • 4,985
  • 4
  • 24
  • 34
  • Do you know why it doesn't work in here? `rawimg=readJPEG("church.jpg") rawimg=t(rawimg) #rawimg=t(blur(as.im(rawimg), sigma=6)) rawimg=rawimg[,ncol(rawimg):1]` I receive this error: `Error in `[.im`(rawimg, , ncol(rawimg):1) : The subset operation is undefined for this type of index ` – Mona Jalal Apr 17 '14 at 02:28
  • If you don't have a black and white image, your image will be a list of three matrices, each for one channel of rgb (red, green and blue). Hence you can't use the t() command. – nnn Apr 23 '14 at 09:54
  • If you're allowed to use knowledge about the shape of the peaks, then you could improve the result of `blur` even more by using an anisotropic Gaussian kernel by specifying the argument `varcov` instead of `sigma` – Adrian Baddeley Oct 30 '18 at 01:21
  • this can help with rgb vs. greyscale: https://stackoverflow.com/a/27491947/2371031 – Brian D Nov 29 '18 at 17:10
13

I think you should have a look at the focal function in the raster package. For example (copied from the raster documentation):

r <- raster(ncols=36, nrows=18, xmn=0)
r[] <- runif(ncell(r))
# 3x3 mean filter
r3 <- focal(r, w=matrix(1/9,nrow=3,ncol=3))

The documentation include more details.

Paul Hiemstra
  • 59,984
  • 12
  • 142
  • 149
  • Ok, this also would do it. This does a running mean like my first Idea was. But the Gauss blur gives better results. But thanks for the answer anyway. – nnn Jun 12 '13 at 12:53
8

You definitely want to take a look at the EBImage package. There are multiple functions for smoothing your image.

For example, a median filter:

# Load EBImage up
require(EBImage)
# Read in your image
im = readImage('/path/to/your/image')
# Apply a median filter with window size of 7
im.med = medianFilter(im, size=7)
# Display image
display(im.med)

Median filter applied with 7x7

or you could try a gaussian blur:

# Apply a gaussian blur with sigma=4
im.gaus = gblur(im, sigma=4)
# Display image
display(im.gaus)

enter image description here

Hope this helps!

Omar Wagih
  • 8,504
  • 7
  • 59
  • 75
  • 1
    This would also do it, like the Gauss blur in the `spatstat` package or the running mean in the `raster` package. I like the Gauss blur better, because the median filter creates kind of vertical and horizontal stripes. Thanks for the answer. Good to know that there are multiple ways to achieve what I searched for! – nnn Jun 17 '13 at 12:19
  • @by0 what should I do if I receive this error ? `> install.packages("EBImage") Warning in install.packages : package ‘EBImage’ is not available (for R version 3.0.2)` – Mona Jalal Apr 17 '14 at 02:31
  • 1
    Are you trying to install `EBImage` from CRAN? Don't `install.packages('EBImage')`, instead install it from Bioconductor like this `source("http://bioconductor.org/biocLite.R"); biocLite("EBImage")` – Omar Wagih Apr 17 '14 at 13:27