3

I would like to fill the area under a step function line I ploted using plot(X, type='s') I tried polygon with no success.

set.seed(1);y = abs(rnorm(10))
plot(y,ylim=c(0,max(y)), type="p",pch=24)
lines(y, type='s')
abline(h=0)

Say I want to paint in gray under the curve and above y=0 enter image description here

Cœur
  • 37,241
  • 25
  • 195
  • 267
statquant
  • 13,672
  • 21
  • 91
  • 162
  • 1
    possible duplicate of [Shading a kernel density plot between two points.](http://stackoverflow.com/questions/3494593/shading-a-kernel-density-plot-between-two-points) – Roman Luštrik Jun 19 '13 at 11:55
  • 1
    Not really a duplicate, because the use of `type="s"` (stairstep line) adds some complications to the procedure. – Hong Ooi Jun 19 '13 at 12:08

2 Answers2

11
x <- seq_along(y)
y2 <- rep(y, each=2)
y2 <- y2[-length(y2)]
x2 <- rep(x, each=2)[-1]
x3 <- c(min(x2), x2, max(x2))
y3 <- c(0, y2, 0)

# because polygon() is dumb and wants a pre-existing plot
plot(x, y, ylim=c(0, max(y)), type="n")

polygon(x3, y3, border=NA, col="grey")
lines(x2, y2)
agstudy
  • 119,832
  • 17
  • 199
  • 261
Hong Ooi
  • 56,353
  • 13
  • 134
  • 187
2

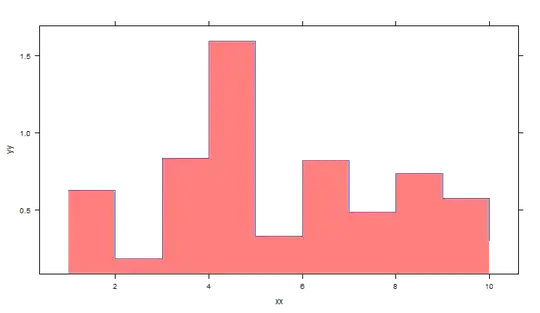
a Lattice solution which is basic an adaptation of excellent HongOoi solution.

set.seed(1)
xx <- c(1:10)
yy <- abs(rnorm(10))

library(lattice)
xyplot(yy~xx,type='s',
       panel=function(x,y,...){
         panel.xyplot(x,y,...)
         y2 <- rep(y, each=2)
         y2 <- y2[-length(y2)]
         x2 <- rep(x, each=2)[-1]
         x3 <- c(min(x2), x2, max(x2))
         y3 <- c(0, y2, 0)
         panel.polygon(x3, y3,col=rgb(1, 0, 0,0.5), border=NA)

       })

enter image description here

agstudy
  • 119,832
  • 17
  • 199
  • 261