73

I am trying to view a page in Google Chrome, but I get the message: "Aw, Snap! Something went wrong while displaying this web page". Is there a way to get more information about what went wrong?

Update: the "Aw, Snap" remark is shown only when the JavaScript console is visible.

Dimitri C.
  • 21,861
  • 21
  • 85
  • 101
  • 54
    It is a programming question - it's related to debugging. – codeinthehole Jul 08 '11 at 20:09
  • 5
    This question is tagged as "debugging" therefore I don't understand why it is closed as off-topic. If the first sentence were re-worded to "...trying to debug..." instead of "...trying to view..." would it then be considered on-topic? The issue is a very common one among developers trying to debug the cutesy "Aw Snap" screen in Chrome. – jeffa00 Aug 12 '14 at 18:29
  • 1
    I'm experiencing something similar. When devtools is open, Aw Snap occasionally appears on page refresh. With devtools closed, never. I've tried debug build in gdb, and logging settings, and so far nothing has given any indication about what the problem is. In the 5~ years since this question was posted, has the debuggability of Aw Snap improved? – mwcz Feb 18 '15 at 15:38
  • 1
    Related: [How to determine what is causing Chrome to show the “Aw, Snap” dialogue](https://superuser.com/q/607563/87805) – kenorb Sep 17 '18 at 14:36

7 Answers7

17

First enable Automatically send some system information and page content to Google to help detect dangerous apps and sites from Settings -->> Advanced -->> Privacy and Security

then enable Crash reporting in Chrome as below

  1. Open chrome://crashes
  2. If it shows crash report as disabled, enable it. If crash happens it will dump the crash report at C:\Users\{username}\AppData\Local\Google\CrashReports

This would give more info when the aw snap screen shows up in chrome

Tarun
  • 748
  • 1
  • 13
  • 30
  • 2
    I believe the current setting is called "Automatically send some system information and page content to Google to help detect dangerous apps and sites" – mmigdol Oct 27 '17 at 10:43
  • Thanks mmigdol for pointing this out, i have update the option labels now to the one exactly present in current chrome browser version. – Tarun Oct 30 '17 at 06:06
  • 13
    What if I don't want to send the shit to Google? I just wnat it myself? – Evan Carroll Dec 17 '17 at 00:25
  • 3
    only says like "Local Crash ID 1a6dcf99-0f2d-47df-93d5-0ce32c4ebd67 Crash report captured on Saturday, February 16, 2019 at 11:54:44 PM was not uploaded. Send now" and then "upload requested by user, not yet uploaded". Folder empty. – Fanky Feb 16 '19 at 23:09
11

I don't know if you'll see much in the non-debug build but try turning on logging and see what shows up:

Launch Chrome with these flags: --enable-logging --log-level=0

On Vista your log file would be in: C:\Users\<username>\AppData\Local\Google\Chrome\User Data\Default

On XP your log file would be in: C:\Documents and Settings\<username>\Local Settings\Application Data\Google\Chrome\User Data\Default

See http://www.chromium.org/for-testers/enable-logging for details.

Pierre-Antoine LaFayette
  • 24,222
  • 8
  • 54
  • 58
  • 2
    Thanks a lot. Regrettably, the log doesn't contain anything helpful. The only thing I see is: [1640:3808:4285503:INFO:user_script_slave.cc(179)] Injected 0 user scripts into – Dimitri C. Nov 20 '09 at 08:23
  • If you build the debug version you'd probably be able to get a callstack. – Pierre-Antoine LaFayette Nov 20 '09 at 15:38
  • There's no uncaught exception, Chrome catches it and displays the Aw Snap page. I ran Chromium through gdb and nothing popped up when Aw Snap appeared. Probably my gdb fu isn't strong enough. – mwcz Feb 18 '15 at 15:23
  • I am getting this on mobile Chrome -- I wonder if there's an equivalent for iOS – Jonathan Jun 30 '16 at 18:22
5

When you run DevTools on the website which is about to crash, it may give you some clues.

For example, when the tab will hit out-of-memory limits, the debugger will pause the code just before the crash (Chrome, Opera, etc.). The memory usage can be checked in the Memory tab.

If the cause is different, run Chrome from the command-line with --enable-logging --v=1 and check the logs (system logs and chrome_debug.log file).

Related:


macOS

If you're on macOS, such crashes should be automatically reported. They can be checked in Console app and check for Crash Reports. Or find them in Finder, the files are located in /Library/Logs/DiagnosticReports (system-wide) and ~/Library/Logs/DiagnosticReports (user).

Check also Chrome logs in real-time, by:

log stream --level debug --predicate 'processImagePath contains "Google"'

See also:


Linux

For Linux, check: How to generate a core dump in Linux when a process gets a segmentation fault?
kenorb
  • 155,785
  • 88
  • 678
  • 743
0

I faced the same problem in chrome, I was using it at Ubuntu operating system, I just update chrome and restart my system and its working fine!

Ashwani Panwar
  • 3,819
  • 3
  • 46
  • 66
0

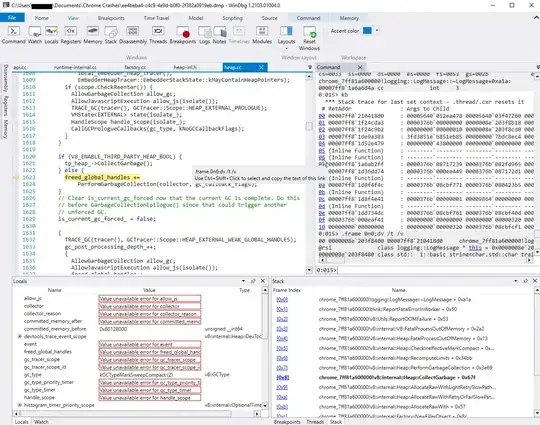
Get a Chrome crash dump (see other answers and a search engine for most up-to-date methods for that) and you can open it in a debugger.

Memory-related issues are usually pretty obvious, like if the heap is overflowing or not being compacted fast enough for new objects to be added. Chrome will try to save itself from crashing by detecting whether the GC was ineffective at marking sufficient things for collection / compaction - "CheckIneffectiveMarkCompact" and "FatalProcessOutOfMemory" where the GC is basically thrashing trying to reclaim memory over and over, but not able to do so. This is usually a sign of "bad" javascript - not necessarily bugs, but design flaws such as loading too many records from an API into memory at once, such as when rendering long lists of data or features on a map. Depending on the device where Chrome is running, it can easily be overtaken and will shut down the site/tab with the "Aw Snap" error.

    #endif  // V8_FUZZILLI
    } else {
      fatal_callback(location,
                     is_heap_oom
                         ? "Allocation failed - JavaScript heap out of memory"
                         : "Allocation failed - process out of memory");
    }

WinDbg.exe Windows Store Edition with a Chrome crash dump .dmp file and the chromium symbols loaded

nothingisnecessary
  • 6,099
  • 36
  • 60
-1

After chrome update my chrome browser was stopped working, So below fix I have applied for time being You can disable sandbox mode by following below 2 ways

either you can run below command "C:\Program Files (x86)\Google\Chrome\Application\chrome.exe" --no-sandbox

or if you have admin rights you can update registry

REG ADD "HKLM\Software\Policies\Google\Chrome" /v RendererCodeIntegrityEnabled /t REG_DWORD /d 0
Manoj Patil
  • 970
  • 1
  • 10
  • 19
-4

That page means that something inside the browser went wrong, so maybe run the browser under a debugger?

  • I didn't downvote, since this is a good suggestion. Just want to note that when my page "Aw Snap!"s, the developer console disconnects, so unfortunately this doesn't seem to help. – Max Heiber Feb 09 '17 at 16:11