Matplotlib's hist says "Compute and draw the histogram of x". I'd like to make a plot without computing anything first. I have the bin widths (unequal), and the total amount in each bin, and I want to plot a frequency-quantity histogram.
For instance, with the data
cm      Frequency
65-75   2
75-80   7
80-90   21
90-105  15
105-110 12
It should make a plot like this:
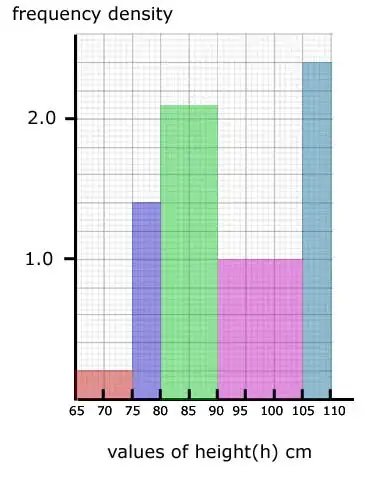
http://www.gcsemathstutor.com/histograms.php
where the area of the blocks represents the frequency in each class.