0

I have been using R to plot a world map and I want to switch to a map that is centered on the Pacific ocean and splits the Atlantic to make my data plot easier.

But the default set of R is like this:

 map("world") 

R default set

And I want the map to be like this:

world map wanted

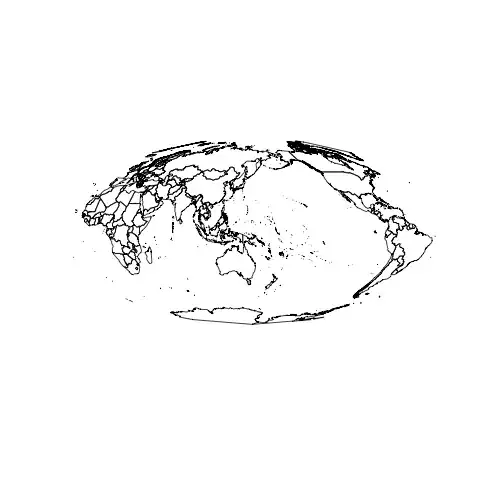
I have tried the help of R worldmap the option "orientation" Even though the help says that " orientation a vector c(latitude, longitude, rotation) describing where the map should be centered and a clockwise rotation (in degrees) about this center. " I still could not use it for example like the following command only produce this:

 map("world",orientation=c(35,104,0)) 

 Warning:
 In map("world", orientation = c(35, 104, 0)) :
 projection failed for some data

the result is like this:

The R plotting odd map

The result is strange. So how can I get something right like Picture 2 have shown? Thank you.

sikisis
  • 458
  • 9
  • 21
  • Would [this Q&A](http://stackoverflow.com/q/10620862) help? – BenBarnes Jul 18 '13 at 09:59
  • Thank you that is really useful! But My problem further is that if I use map like the way You have described I could use the original geo-latitude and longitude that we have commonly used. – sikisis Jul 19 '13 at 03:19

2 Answers2

4

Your example picture seems to be centered around 0 lat, 150 lon. The following seems to roughly generate you example picture:

library(maps)
map("world",orientation=c(90, 150,0), projection="mollweide", wrap=TRUE) 

For some reason it appears you need to add 90 to your longitude.

Jan van der Laan
  • 8,005
  • 1
  • 20
  • 35
  • Thank you! That's really works! But I found if I use your code that way I can not add lines to the map. For example If I want to do as the website [link](http://flowingdata.com/2011/05/11/how-to-map-connections-with-great-circles/) I could not successfully run the code 'lat_ca <- 39.164141 lon_ca <- -121.640625 lat_me <- 45.213004 lon_me <- -68.906250 inter <- gcIntermediate(c(lon_ca, lat_ca), c(lon_me, lat_me), n=50, addStartEnd=TRUE) lines(inter)' – sikisis Jul 19 '13 at 03:10
  • If all things are right the code will show a line linking two place in the map but the code fails. That's why? Thank you! – sikisis Jul 19 '13 at 03:11
  • Can you see my comments? Thank you! – sikisis Jul 21 '13 at 07:32
1

This is a more complex solution but a nice training exercise to learn how to deal with SpatialPolygons objects.

library(maptools)
library(rgdal)
data(wrld_simpl) #The world as a SpatialPolygonsDataFrame
#To avoid the lines crossing the map after reprojection we need to cut the polygons at the new break:
w <- nowrapRecenter(wrld_simpl, offset = 180-150, avoidGEOS=TRUE)
#Then proceed with the reprojection (note the proj4 string for a mollweide projection with 150°E as the new center)
wrld_china <- spTransform(w, CRS("+proj=moll +lon_0=150"))
plot(wrld_china)

enter image description here

plannapus
  • 18,529
  • 4
  • 72
  • 94