4

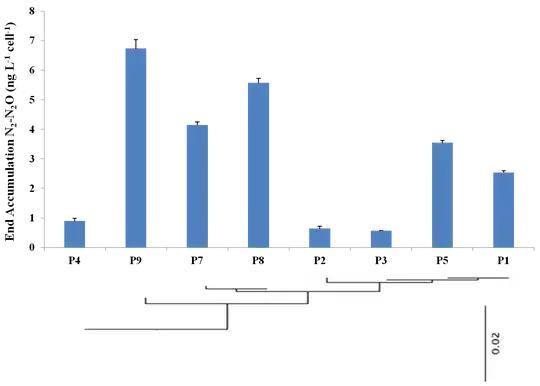
I'm trying to arrange a phylogenetic tree onto a graph showing physiological data for a set of related organisms. Something like the picture below. This was put together in powerpoint from 2 separate graphs. I guess it gets the job done, but I was hoping to create a single image which I think will be easier to format into a document. I am able to produce the graph I want using ggplot2, and import the tree using ape. I was thinking there should be a way to save the tree as a graphical object and then arrange it with the graph using the gridarrange function in gridExtra. The problem is that ape won't let me save the tree as a graphical object, e.g.,

p2<-plot(tree, dir = "u", show.tip.label = FALSE)

just plots the tree and when you call p2 it just gives a list of arguments. I'm wondering if anyone has any tips.

Thanks!

enter image description here

C_Z_
  • 7,427
  • 5
  • 44
  • 81
user2055130
  • 396
  • 2
  • 12
  • looks [similar to this](http://stackoverflow.com/questions/17370853/align-ggplot2-plots-vertically/17371177#17371177) – baptiste Jul 22 '13 at 23:06
  • To clarify: Your top image comes from ggplot, while the phylogenetic tree is drawn using the base plotting system. So you want to combine a ggplot, and base plot, on the same image. I think the answer, if there is one, will be more trouble than its worth. – Scott Ritchie Jul 22 '13 at 23:17
  • Top image would come from ggplot2, tree from ape. If there is some way of importing a tree into ggplot2 that would be fine, I'm just not aware of it. – user2055130 Jul 22 '13 at 23:33
  • The `gridBase` package has facilities for mixing `grid` and `base` graphics. `gggplot2` is one form of `grid` graphics. – IRTFM Jul 22 '13 at 23:41

2 Answers2

3

I'm not sure if that will work with gtable from CRAN

require(ggplot2)
require(gridBase)
require(gtable)

p <- qplot(1,1)
g <- ggplotGrob(p)

g <- gtable_add_rows(g, unit(2,"in"), nrow(g))
g <- gtable_add_grob(g, rectGrob(),
                     t = 7, l=4, b=7, r=4)

grid.newpage()
grid.draw(g)

#grid.force()
#grid.ls(grobs=F, viewports=T)
seekViewport("layout.7-4-7-4")
par(plt=gridPLT(), new=TRUE)
plot(rtree(10), "c", FALSE, direction = "u")
upViewport()

enter image description here

baptiste
  • 75,767
  • 19
  • 198
  • 294
1

first I'd like to thanks baptiste for ALL his multiple answers that solved most of my issues with ggplot2.

second, I had a similar question which was to include a tree from ape inside a heatmap obtained with ggplot2. Baptiste made my day, and though my simplified version could help. I used only what was useful for me (removing the addition of gg_rows).

library(ape)
tr <- read.tree("mytree.tree")
# heat is the heatmap ggplot, using geom_tile
g <- ggplotGrob(heat)
grid.newpage()
grid.draw(g)
# use oma to reduce the tree so it fits 
par(new = TRUE, oma = c(5, 4, 5, 38))
plot(tr)
nodelabels(tr$node.label, cex = 1, frame = "none", col = "black", adj = c(-0.3, 0.5))
add.scale.bar()
# use dev.copy2pdf and not ggsave
dev.copy2pdf(file = "heatmap_prob.pdf")

the result is here heatmaptree

Community
  • 1
  • 1
aurelien
  • 859
  • 1
  • 15
  • 22