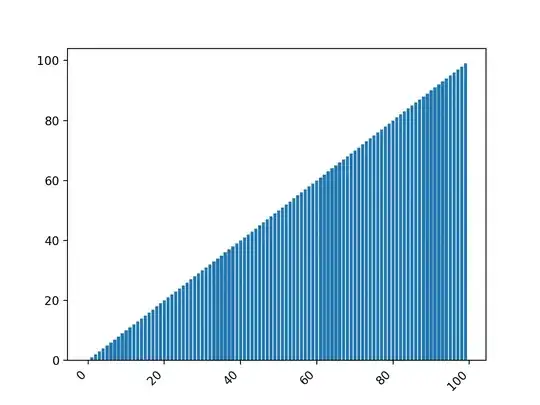
I am plotting a bar chart in python using matplotlib.pyplot. The chart will contain a large number of bars, and each bar has its own label. Thus, the labels overlap, and they are no more readable. I would like that the label are displayed diagonally so that they do not overlab, such as in this image.
This is my code:
import matplotlib.pyplot as plt
N =100
menMeans = range(N)
ind = range(N)
ticks = ind
fig = plt.figure()
ax = fig.add_subplot(111)
rects1 = ax.bar(ind, menMeans, align = 'center')
ax.set_xticks(ind)
ax.set_xticklabels( range(N) )
plt.show()
How can the labels be displayed diagonally?

