-3

I have a ascii file containing 2048 x and y value pairs. I just want to know how to plot fft of y in MATLAB. I am writing following MATLAB code but could not be able to find appropriate result.

How can I do this? This is what I have tried:

I = load('data1.asc');

for i = 1:2048
    y = I(:,2);
end

plot(x)

Fs = 40000;                    
T = 1/Fs;                   
L = 2000;     
NFFT = 2^nextpow2(L);
Y = abs(fft(y,NFFT))/L;
f = Fs/2*linspace(0,1,NFFT/2+1);

figure, plot(f,2*abs(Y(1:NFFT/2+1))) 
axis([0 40000 0 40])
xlabel('Frequency (Hz)')
ylabel('|Y(f)|')
oberlies
  • 11,503
  • 4
  • 63
  • 110
  • 1
    Also, it's recommended that you don't use `i` or `j` as variables in Matlab, since they refer to sqrt(-1): http://stackoverflow.com/questions/14790740/using-i-and-j-as-variables-in-matlab – David K Jul 24 '13 at 12:24
  • Well, I understand, that creating the fft is not self-explaining. The first time I was struggeling too. But there are some really good examples, that should help, like this: [understanding fft with matlab](http://stackoverflow.com/questions/10758315/understanding-matlab-fft-example?rq=1) – Lucius II. Jul 26 '13 at 10:03
  • 2
    You need to stop asking the same question over and over, and trying to hide being two different user IDs. That question has already been answered. – am304 Jul 26 '13 at 12:44

2 Answers2

4

Instead of diving straight into MATLAB's FFT routine you should instead consider using the periodogram function. When people say "FFT" they usual mean PSD or periodogram, i.e. a plot of power spectral density using a suitably windowed and FFTed sample. The periodogram function in MATLAB takes care of all the details of this for you, i.e. applying a window function, calculating the FFT, deriving magnitude from FFT output, appropriate scaling of axes, and even plotting if required.

Note: periodogram is in the MATLAB Signal Processing Toolbox - if you do not have access to this then you can either consider using Octave (free MATLAB clone) which has a periodogram clone, otherwise you would need to put the various building blocks together yourself:

  • window function
  • FFT
  • calculate magnitude
  • take scare of scaling of freq and magnitude values
  • plot PSD
Paul R
  • 208,748
  • 37
  • 389
  • 560
  • Whilst I agree with your sentiment. Many people don't have the signal processing toolbox. – mor22 Jul 26 '13 at 10:50
  • @mor22: good point - I use Octave (free MATLAB clone) which has a `periodogram` clone. I'll add a note in my answer. – Paul R Jul 26 '13 at 11:20
1

The fft part of the code looks good to me. However, this bit doesn't make much sense:

for i = 1:2048
    y = I(:,2);
end

What are you trying to do here? You're not using the loop index i at all in the for loop.

Also, I assume y is of length 2000, can you confirm? Otherwise L = 2000 should be changed to L = length(y). Similarly, I assume that the sampling frequency of the data is 40kHz, otherwise Fs = 40000 is not correct.

EDIT following discussion in comments:

With the data that you have provided, I get the same results. The only thing I did is exclude the last data point from the analysis when it drops to zero. The way you read the data still doesn't make sense to me. Note I am using Octave, not MATLAB, but the code should give the same results in MATLAB.

load('ascii_value.txt')
y = ascii_value(1:end-1,2);
plot(y)
L=length(y);
Fs = 40000;
T = 1/Fs;
NFFT = 2^nextpow2(L);
Y = abs(fft(y,NFFT))/L;
f = Fs/2*linspace(0,1,NFFT/2+1);
figure, plot(f,2*abs(Y(1:NFFT/2+1)))
axis([0 40000 0 40])
xlabel('Frequency (Hz)')
ylabel('|Y(f)|')

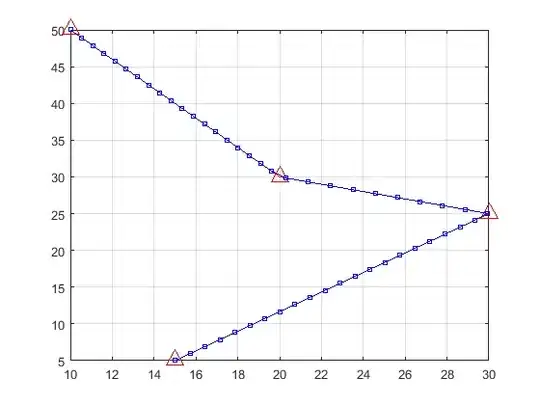
The signal looks like this:

enter image description here

and the FFT like this:

enter image description here

Note: if you are sampling at 40 kHz, your FFT can only go up to 20kHz (Nyquist frequency).

am304
  • 13,758
  • 2
  • 22
  • 40
  • Also what is "appropriate result"? Have you plotted `y` to check it is what you expect it to be? – am304 Jul 24 '13 at 08:46
  • Thanks for giving the answer. I have removed for loop and L to length(y). And the sampling frequency is 40 KHz that's why i have taken 40000. But till now i have not get appropriate result. – Neerajiitb Jul 24 '13 at 09:20
  • Thanks for giving the answer. Actually appropriate result means, when i am plotting this fft by another software(SW 340). It gives different result. Actually I want to plot fft of a signal found from software of oscilloscope(SW 340). I am sending you the link of images whcich consist of signal image, ascii value of signal, fft of signal from that software. Please help to plot fft in matlab using that ascii value found from that signal. https://drive.google.com/folderview?id=0B8088wYdlZ4iNkJma0tfVVNpRUU&usp=sharing – Neerajiitb Jul 24 '13 at 09:27
  • You still haven't answered what it is you are trying to do with your for loop. As it stands, it doesn't make sense. – am304 Jul 24 '13 at 10:17
  • PS: according to the FFT results, the "peak" is at 7.19kHz and the value is about 4.06, compared to your 3.7 at 7.21kHz. – am304 Jul 24 '13 at 10:33
  • Thanks for taking your interest in my problem. But the main problem is about the peak of fft. I need almost same amplitude of peak at almost same frequency for our research work. I am sending link of another image of signal(SW 340), fft(obtained from other software ie SW 340) and ascii value. https://drive.google.com/folderview?id=0B8088wYdlZ4iOEFVaF9XZ2I0d00&usp=sharing – Neerajiitb Jul 24 '13 at 12:48
  • Main problem is to find amplitude of peak of fft. Please suggest how to make it possible ie to get similar fft as obtained from the software sw340. I am very much exhausted from the couple of week to find the same fft. Thanks in advance. – Neerajiitb Jul 24 '13 at 12:51
  • It is the same!! Well, almost, based on two different FFT algorithms, with different accuracies, etc... I don't think you can ask for more. How do you know you other software's estimate (because it is just that, an estimate) is the "right" answer? – am304 Jul 24 '13 at 13:09