51

I want to create labels to my plots with the latex computer modern font. However, the only way to persuade matplotlib to use the latex font is by inserting something like:

title(r'$\mathrm{test}$')

This is of course ridiculous, I tell latex to start math mode, and then exit math mode temporary to write the actual string. How do I make sure that all labels are rendered in latex, instead of just the formulas? And how do I make sure that this will be the default behaviour?

A minimal working example is as follows:

import matplotlib as mpl
import matplotlib.pyplot as plt
import numpy as np

# use latex for font rendering
mpl.rcParams['text.usetex'] = True


x = np.linspace(-50,50,100)
y = np.sin(x)**2/x
plt.plot(x,y)

plt.xlabel(r'$\mathrm{xlabel\;with\;\LaTeX\;font}$')
plt.ylabel(r'Not a latex font')
plt.show()

This gives the following result:

Plot showing incorrect rendering of latex font types

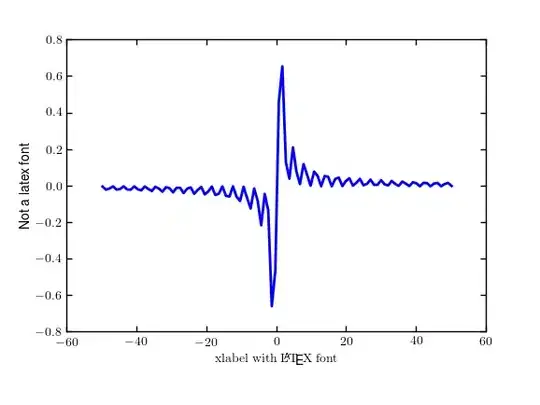
Here the x axis is how I want the labels to appear. How do I make sure that all labels appear like this without having to go to math mode and back again?

psxls
  • 6,807
  • 6
  • 30
  • 50
Dirklinux
  • 1,075
  • 1
  • 11
  • 19
  • 1
    On my system the default behavior is that `usetex` enables LaTeX for everything, and actually I'm exactly looking for the behavior you describe (LaTeX only for `$...$`). Since all answers only mention how `font.family` must be set to achieve your case, it would be great if you could specify the alternative that achieves these non-LaTeX fonts... – bluenote10 Feb 17 '14 at 12:19

3 Answers3

55

The default Latex font is known as Computer Modern:

from matplotlib import rc
import matplotlib.pylab as plt

rc('font', **{'family': 'serif', 'serif': ['Computer Modern']})
rc('text', usetex=True)

x = plt.linspace(0,5)
plt.plot(x,plt.sin(x))
plt.ylabel(r"This is $\sin(x)$", size=20)
plt.show()

enter image description here

Greg
  • 11,654
  • 3
  • 44
  • 50
  • 2
    Thanks! This can be enabled by default by changing the matplotlibrc file. Set: tex.usetex = True font.family = serif font.serif = cm – Dirklinux Aug 14 '13 at 19:57
  • It works but I cannot save the plots in EPS format (PNG works fine). In my case I'm using the 'Times' font. It is not exactly the same but similar enough and EPS works fine. – Paglian Jan 12 '17 at 18:28
  • 1
    Alternatively, `matplotlib.rcParams['font.family'] = 'serif'` and `matplotlib.rcParams['font.serif'] = ['Computer Modern']` – aquirdturtle Oct 20 '21 at 04:07
12

I am using matplotlib 1.3.1 on Mac OSX, add the following lines in matplotlibrc works for me

text.usetex : True
font.family : serif 
font.serif  : cm

Using = leads to a UserWarning: Illegal line

CyLiu
  • 401
  • 3
  • 5
9

The marked answer can be enabled by default by changing a few lines in the matplotlibrc file:

text.usetex = True
font.family = serif 
font.serif = cm
psxls
  • 6,807
  • 6
  • 30
  • 50
Dirklinux
  • 1,075
  • 1
  • 11
  • 19